NEAR HTFAs you can see where is the buy zone on the chart, I think that would be decent spot to pick NEAR for long term!
NEARUSD

NEAR/USDT :: Range box , Safe lines .NEAR/USDT :::
_ As long as the crypto market takes direction, it will move between these lines .

NEARUSD ❕ good potential for growthNEAR is moving in a downward channel within the wide-band candlestick zone.
The drop in price is accompanied by a decrease in trading volumes.
TD Sequential formed a reversal signal up (1H TF)
I think NEAR could rise if it consolidates above the nearest resistance level, but the most interesting movement will be when the asset is able to consolidate above the current range.

There is a trouple bottom on NEAR 4h !Price is in the downtrend channel and try to break out .
If it break out with the short wicks
TP1: 1(4.570)
TP2: 1.272(4.809)
TP3: 1.382(4.905)
TP4: 1.5(5.009)
SL : 4.088

NEAR Protocol (NEAR) - September 2Hello?
Welcome, traders.
By "following", you can always get new information quickly.
Please also click "Like".
Have a good day.
-------------------------------------
(NEARUSDT 1W Chart)
The key is to keep the price above 3.802 and break out of the downtrend line.
(1D chart)
The price must remain above the HA-Low indicator to transition to an uptrend.
So, you need to make sure you keep the price above 4.063.
- The Stoch RSI indicator is entering the overbought zone.
So, when the Stoch RSI moves out of the overbought zone, you need to see if the price holds at or above the 3.802-4.063 range.
- In order to continue the uptrend, the price must be maintained above the HA-High indicator.
Therefore, it should find support near 4.184 and move above 5.543 or shake up and down to cause the HA-High to decline.
------------------------------------------------------------ -------------------------------------------
** All descriptions are for reference only and do not guarantee a profit or loss in investment.
** The MRHAB-T indicator, which is inactive on the chart, contains indicators that indicate support and resistance points.
** Background color of Long/Short-S indicator: RSI oversold and overbought sections
** Background color of CCI-C indicator: When the short-term CCI line is below -100 and above +100, oversold and overbought sections are displayed.
** The OBV indicator was re-created by applying a formula to the DepthHouse Trading indicator, an indicator disclosed by oh92. (Thanks for this.)
(Short-term Stop Loss can be said to be a point where profit and loss can be preserved or additional entry can be made through split trading. It is a short-term investment perspective.)
---------------------------------

✅TS ❕ NEARUSD: sideways✅✅NEAR moves sideways. The price has reached the resistance level. A bounce down is possible.✅
🚀 SELL scenario: short to 3.84.🚀
----------------------------------------------------------------------------
Remember, there is no place for luck in trading - only strategy!
Thanks for the likes and comments.

NEAR/USDT ChartHi, I try to post often so if you could follow and like it would mean a lot to me
I did this prediction a while ago on my stream and we just reached the target. After a consistent run, it is time so short NEAR. My main target is 4.06$ and after that we can see a bounce or just go down to 3.70$. Comment what you think.
I did a BTC idea today, so check that out. Late night stream today at 00.30 UK time/BST. I will be answering your questions and talk about the market. If you want me to do an analysis about a coin that you hold come to the stream. I hope I see you there.

Near bearish sentiment September has major catalysts for the crypto market as well as for the stock market.
The Ethereum merge on September 6th, that will end on Sept 20, the inflation report on September 13 and the next FOMC meeting afterwards with the new interest rates hike.
That is reflected in the crypto space in general as a bearish outlook.
NEAR is a cypto with a negative overall sentiment recently.
I have the following price targets:
NEAR/USDT short
Entry Range: $4.00 - 4.35
Price Target 1: $3.65
Price Target 2: $3.20
Price Target 3: $2.95
Stop Loss: $4.85

NEARUSD ❕ upper boudanry of the downward channelNEAR is moving under liquidity, within the descending channel.
TD Sequential has formed a reversal signal up (30m TF)
I believe that the asset will continue to fall after consolidating under the upper limit of the channel.

NEARUSDT IS ABOUT TO BREAKOUTNEAR is forming a cup pattern and its about to breakout.
!! BUY &SELL in the chart !!

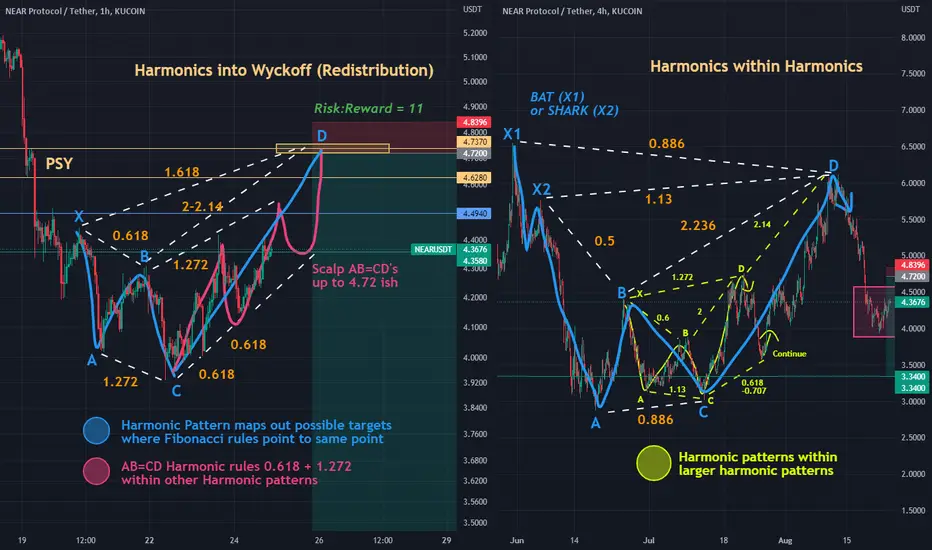
NEAR - Mixing Harmonic Patterns with WyckoffMixing Harmonic Patterns with Wyckoff Law (and also confirming with Elliot Wave where applicable) can be one of the most effective ways to trade.
The AB=CD pattern comes within many Harmonic patterns such as the Shark, Crab or Bat. You can scalp movements like this within confirmed (or very possible) harmonic patterns that all point to a singular number.
You can also trade smaller harmonics within bigger harmonics, as long as you map out the bigger harmonic first, so you have an idea where the market is heading mid-long term.
In the example above, we use altcoin NEAR Protocol. We first check the 4 hour to find bigger harmonics, and then switch down to the 1 hour or 15 mins and trade those timeframes, depending on what we prefer.
Currently, NEAR on the 1 hour timeframe is pointing towards 4.72 via the 1.618 and the 2/2.14 fibs. It makes sense that price would top here, because of the "Preliminary Supply / PSY" Section as seen in Wyckoff Redistribution Schematic #4 (For more info on this, please check my "Link to Related Ideas" below, where I describe this in more detail on a Bitcoin chart.
You could also use Elliot Wave analysis here to map out the 5 waves upwards towards 4.72. Perhaps the final 5th wave points to a 1.272 or 1.618 expansion?
NEARUSD ❕ broke up the downtrend lineTrading volumes show no interest in falling prices.
NEAR is under liquidity.
I wouldn't count on a strong rebound right now, but we could grab a small profit if price fixes above the resistance level.

#NEAR $NEAR This is our Technical Analysis on #NEAR 4h!
In 4h TF NEAR is on RANGE Market
Give attention to strong levels when price reach there!

✅TS ❕ NEARUSD: strong downtrend✅✅NEAR is moving in a strong downtrend. The price has almost reached a significant minimum. I expect a downward movement with an update of the minimum.✅
🚀 SELL scenario: short to 3.4.🚀
----------------------------------------------------------------------------
Remember, there is no place for luck in trading - only strategy!
Thanks for the likes and comments.

NEAR Protocol (NEAR) - August 22hello?
Welcome, traders.
By "following", you can always get new information quickly.
Please also click "Like".
Have a good day.
-------------------------------------
(NEARUSDT 1W Chart)
The key is whether the price can be maintained above the 2.792-3.545 range.
(1D chart)
Resistance: 5.051
1st support: 3.802-4.184
2nd support: 2.792-3.545
We need to see if we can support near the 3.802-4.184 section and rise above 5.051.
- The RSI, Stoch RSI and CCI(9) indicators are entering the oversold zone.
So, it's a good idea to see where you find support and resistance until you break out of the oversold zone.
------------------------------------------------------------ -------------------------------------------
** All descriptions are for reference only and do not guarantee a profit or loss in investment.
** The MRHAB-T indicator, which is inactive on the chart, contains indicators that indicate support and resistance points.
** Background color of Long/Short-S indicator: RSI oversold and overbought sections
** Background color of CCI-C indicator: When the short-term CCI line is below -100 and above +100, oversold and overbought sections are displayed.
** The OBV index was re-created by applying a formula to the DepthHouse Trading index, an index disclosed by oh92. (Thanks for this.)
(Short-term Stop Loss can be said to be a point where profit and loss can be preserved or additional entry through split trading. It is a short-term investment perspective.)
---------------------------------

💡Don't miss the great buy opportunity in NEARUSD @NEARProtocolTrading suggestion:
". There is a possibility of temporary retracement to the suggested support line (4.749).
. if so, traders can set orders based on Price Action and expect to reach short-term targets."
Technical analysis:
. NEARUSD is in an uptrend, and the continuation of the uptrend is expected.
. The price is above the 21-Day WEMA, which acts as a dynamic support.
. The RSI is at 72.
Take Profits:
TP1= @ 5.198
TP2= @ 5.631
TP3= @ 6.497
TP4= @ 7.628
TP5= @ 8.877
SL= Break below S2
❤️ If you find this helpful and want more FREE forecasts in TradingView
. . . . . Please show your support back,
. . . . . . . . Hit the 👍 LIKE button,
. . . . . . . . . . Drop some feedback below in the comment!
❤️ Your support is very much 🙏 appreciated! ❤️
💎 Want us to help you become a better Forex / Crypto trader ?
Now, It's your turn !
Be sure to leave a comment; let us know how you see this opportunity and forecast.
Trade well, ❤️
ForecastCity English Support Team ❤️

💡Don't miss the great buy opportunity in NEARUSD @NEARProtocolTrading suggestion:
". There is a possibility of temporary retracement to the suggested support line (4.749).
. if so, traders can set orders based on Price Action and expect to reach short-term targets."
Technical analysis:
. NEARUSD is in an uptrend, and the continuation of the uptrend is expected.
. The price is above the 21-Day WEMA, which acts as a dynamic support.
. The RSI is at 72.
Take Profits:
TP1= @ 5.198
TP2= @ 5.631
TP3= @ 6.497
TP4= @ 7.628
TP5= @ 8.877
SL= Break below S2
❤️ If you find this helpful and want more FREE forecasts in TradingView
. . . . . Please show your support back,
. . . . . . . . Hit the 👍 LIKE button,
. . . . . . . . . . Drop some feedback below in the comment!
❤️ Your support is very much 🙏 appreciated!❤️
💎 Want us to help you become a better Forex / Crypto trader?
Now, It's your turn!
Be sure to leave a comment; let us know how you see this opportunity and forecast.
Trade well, ❤️
ForecastCity English Support Team ❤️


NEARcoin: NEAR
time frame: 1d
HOLD
Enter:
4.837 20%
3.529 20%
2.384 40%
SL: 1.674
TP:
5.769 , 6.302 ZONE
8.236 , 9.436 ZONE
19.001, 20.451 ZONE
LV1

NEARUSD ❕ the ascending structure is brokenTrading volumes declined.
NEAR went down under liquidity.
The upward structure was broken (4H TF)
I think NEAR will be able to continue the downward movement after the price fixes under the support level.

NEAR NEAR / USDT
86% Crash from the 2021 Bullrun top
Finally Bulls start to show some actions here at the uptrend line in which price was pumped hard every time when touched it
As long as we stay above this support , the priority is for bulls and this might be the bottom for this coin
Invalidation : loss uptrend-line
Best of wishes

NEAR Protocol NEAR Entry Range, Take Profit and Stop LossNEAR/USDT
Entry Range: $5.50 - 6.20
Price Target 1: $7.30
Price Target 2: $8.10
Price Target 3: $8.85
Stop Loss: $4.90

NEAR channel correction! Forecast !#NEAR
▪️We are trading in an ascending channel + indicators are strongly overbought, I think a correction to the lower border is possible soon!
Subscribe. stay tuned for ideas! Links below👇
