TS ❕ NEARUSD: bounced offNEAR continues to move in a downtrend. I expect the fall to continue to the support level.
SELL scenario: short to 8.37.
----------------------------------------------------------------------------
Remember, there is no place for luck in trading - only strategy!
Thanks for the likes and comments.
NEARUSD

NEARUSD ❕ NEAR weakenedNEAR continues to fall and holds the volatility for now.
The price movement forms a downtrending channel.
I expect that in case NEAR fixes under the resistance level, it will continue to fall to the indicated support level.

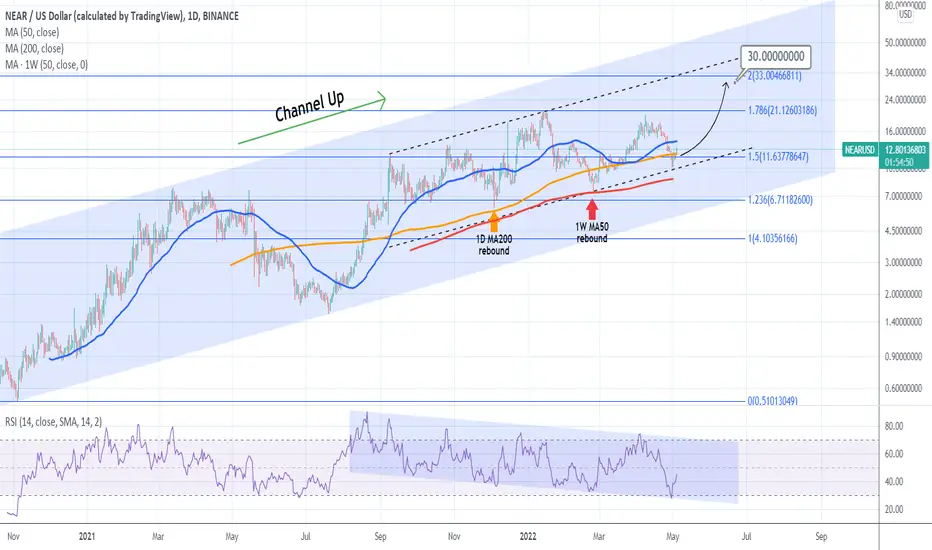
NEARUSD Optimal buy level. Channel Up targeting $30.00.The Near Protocol (NEARUSD) is currently rebounding after making a new Higher Low on the 7-month Channel Up just below the 1D MA200 (orange trend-line). The true Support is the 1W MA50 (red trend-line), which provided a rebound last time it made contact with the price on February 24.
Since it firs started trading, NEARUSD has filled all Fibonacci extensions, with the latest being the 1.786. Naturally, the next fill should be Fib ext 2.0, which is exactly on 33.000. Technically, that would make a perfect Higher High on the Channel Up pattern.
--------------------------------------------------------------------------------------------------------
Please like, subscribe and share your ideas and charts with the community!
--------------------------------------------------------------------------------------------------------
NEARUSD ❕ A battle between buyers and sellersThe 100MA has crossed down 200MA on the 4H Timeframe.
Volume rises as levels are reached.
I expect that now we will continue to accumulate liquidity, so when the price fixes above the support level, I bet on growth.

NEARUSD ❕ destroyed his growthThe price is moving in a downward channel.
The 50MA has crossed down 200MA on the 4H Timeframe.
Price NEAR is declining with increased trading volume.
I expect retest and fixing under the resistance level, and after reaching the indicated support level.

TS ❕ NEARUSD: has brokenNEAR has broken the level down and continues to fall. Now there is a correction. I expect the fall to continue after the end of the correction.
SELL scenario: short to 11.9.
----------------------------------------------------------------------------
Remember, there is no place for luck in trading - only strategy!
Thanks for the likes and comments.

$NEAR: 15 TO 12 DROPTell me not to short the pullback? very clear breaout of a strong support that has been holding for several weeks! Now price going for a retest before we see the massive sell off in $NEAR
I've already anticipated this scenario as you can see here:

NEAR/USDT : Consolidating into a RANGEBYBIT:NEARUSDT
Hello everyone 😃
Before we start to discuss, I'll be so glad if you share your opinion on this post's comment section and hit the like button if you enjoyed it!
$NEAR has formed a wide range channel which has held the pair for 25 days.
Now it has gained bullish momentum once again as it's broken above the range's mid!
But so; As we all know, There'll be always fake-out or deviations...
In terms of possible rejections, I just mentioned the two possible scenarios to trade with :
- Be noticed that both of them need active management with tight SL and multiple targets!
📈 Bullish scenario: Currently the most possible scenario is to face more bullish continuation, In this way; If we get closings above the mentioned S/R line at $15.1, Then you can locate your Longs on a proper retest of the broken marked line.
- Be advised that the SL should be located below the Range's mid with active management!
📉 Bearish scenario: $BTC has reached one of the main S/R lines at $40600, As it consolidates below the resistance; There'll be always a chance of quick rejection into yesterday's lows...
In terms of rejection; If we get closings below the Range's mid at $14.7, Then you can locate your Shorts on a proper retest of the broken marked line.
- Be advised that the SL should be located above the S/R line at $15.1 with active management!
Hope you enjoyed the content I created, You can support us with your likes and comments!
Attention: this isn't financial advice we are just trying to help people with their vision.
Have a good day!
@Helical_Trades

NEARUSD ❕ near before the local correctionSince the last idea, the price broke the ascending channel down and many factors point to a downward movement, but locally we can expect a correction before the support level. In case of a false breakdown and fixation above the support level I expect the resistance level to be reached.

TS ❕ NEARUSD: support levelNEAR reached the support level, in addition, the price broke through the ascending channel. I expect the downward movement to continue.
SELL scenario: after correction, long to 11.9.
----------------------------------------------------------------------------
Remember, there is no place for luck in trading - only strategy!
Thanks for the likes and comments.

$NEAR H&S Warning!After up treding for several weeks, $NEAR could't print a new higher high and now price is in a correction phase bofere an impulse to the down side to print the new lower low!
I am only taking this trade after a daily close below neckline of the H&S pattern. If price bounced from the neckline I will be waiting for the short in the shoulders resistance if market bias is still bearish (Talking about $BTC)

NEAR Protocol (NEAR) - April 25hello?
Traders, welcome.
By "following", you can always get new information quickly.
Please also click "Like".
Have a nice day.
-------------------------------------
(NEARUSDT 1D Chart)
(buy)
- After confirming the support around 13.495
(Stop Loss)
- When it falls below 12.780 and receives resistance
- When it falls below 11.120
(Sell)
- When receiving resistance near 16.480
- When receiving resistance in the section 20.180-21.414
Support is found near 14.752 and is likely to move higher.
However, it is difficult to set Stop Loss at this point, and it is a moving point, so I think it is better not to buy it.
------------------------------------------------------------ -----------------------------------------------------
** All indicators are lagging indicators.
Therefore, it is important to be aware that the indicator will move accordingly as price and volume move.
However, for convenience, we are talking in reverse for the interpretation of the indicator.
** The MRHAB-T indicator used in the chart is an indicator of our channel that has not been released yet.
** The OBV indicator was re-created by applying a formula to the DepthHouse Trading indicator, an indicator disclosed by oh92. (Thanks for this.)
** Support or resistance is based on the closing price of the 1D chart.
** All descriptions are for reference only and do not guarantee a profit or loss in investment.
(Short-term Stop Loss can be said to be a point where profit and loss can be preserved or additional entry can be made through split trading. It is a short-term investment perspective.)
---------------------------------

NEAR/USD - Don't touch. Wait to see if $13 holds!Raising wedge in blue = bearish formation.
If support won't hold at $13. It's over. Don't be fooled, be patient.
See chart.

TS ❕ NEARUSD: bounced offThe price has broken through the lower boundary of the ascending channel, which means a possible trend change. I expect a downward movement.
SELL scenario: short to 13.413.
----------------------------------------------------------------------------
Remember, there is no place for luck in trading - only strategy!
Thanks for the likes and comments.

Near SellStopOrderNear had great movements, Bulls made everything they wanted in last crypto bull run. Now maybe bears will take responsibility for the next movements. Sell Stop Order is the best position in this situation. Good Luck !

NEAR BullflagConsidering this whole upper structure as a bullflag, ultimately leading to continuation of the previous bull market
The alternative outcome is that the formation acts as a double top and price comes back to the channel
The bullish state of the indicator on this daily frame is welcomed although

TS ❕ NEARUSD: lower borderNEAR reached the lower border of the channel and bounced up. I expect movement to the resistance level.
BUY scenario: long to 17.5.
----------------------------------------------------------------------------
Remember, there is no place for luck in trading - only strategy!
Thanks for the likes and comments.

#NEAR/USDT 4HOUR UPDATE BY CRYPTOSANDERS Hello community members welcome to the NEAR/USDT 4hr chart analysis by CRYPTOSANDERS
I have tried my best to bring the best possible outcome to this chart.
As we can see from the above-mentioned chart that NEAR/USDT broke the triangle pattern and retested well.
According to the current scenario, it can move up by almost 30% from the green zone which is also a support zone.
So, here we can take a long position for some short-term profit gains.
Entry:- $15.566,$16.090
Traget:- 30%
Stoploss:- $14.950
Remember:-This is not a piece of financial advice. All investment made by me is at my own risk and I am held responsible for my own profit and losses. So, do your own research before investing in this trade.
Happy trading.
Sorry for my English it is not my native language.
Do hit the like button if you like it and share your charts in the comments section.
Thank you...

NEARUSD ❕ NEAR is back in the channelFrom the previous idea, the price did not reach the entry point and returned to the ascending channel. Volumes on the rise have increased, and the price is now above the strong support level. Now the price is near the resistance level, I expect fixing above it, and after reaching the target indicated on the chart.

$NEAR 1D candles updatekept alerts for 17.97 line as it stays key
lets see how we close on $BTC too
more charts soon
LTFs/EMAs ww

NEAR making bearish shark target $12.11NEAR is making bearish shark harmonic on daily and Head & Shoulders pattern on 4 hourly. Looks like this will break down if ascending trend line resistance is broken. This is a VERY HIGH RISK trade. ONLY for PRO future traders. Good luck.

NEARUSDT 1D Near protocol, possible x3 rise for 3 months?Today, we bring to your attention the analysis and possible medium-term trade of the pair Nearusdt
In recent times, a lot of news has been circulating around the Near protocol, some of them official, and some at the level of rumors or conjectures. But we here are not for this, we are translating into text what we see on the chart.
On the chart, we see increased trade turnover, which means the interest and struggle of buyers and sellers at key levels. In general, today, Near is in the top 10 in terms of trade volume around the all crypt , a worthy result to offer a medium-term trade.
We set up a procurement area of $14.10-14.80 for ourselves. Tonight the minimum was $14.70. At the moment - there is still the possibility of falling the price in the desired area of purchase.
Fixing the price NEARUSD above $16.30 will mean that the price movement has begun.
As can be seen from the history of trading in the area of $13 traded mirror level , which at one time skillfully alternately played the role of support and resistance.
Therefore, it is logical to place the stop below $13.
In this trade, we see three logical take profits, and each individual will be able to choose a comfortable trade for themselves.
In summary, we obtain the following initial data for the trade:
The entrance area to the long - $14.10-14.80
Stop - $12.99
TP1 - $20.60
TP2 - $28.60
TP3 - $41.40-42.00
_______________________________
Since 2016 , we have been analyzing and trading the cryptocurrency market.
We transform our knowledge, trading moods and experience into ideas. Each "like under the idea" boosts the level of our happiness by 0.05%. If we help you to be calmer and richer — help us to be happier :)

NEARUSD ❕ uptrend breakoutThe NEAR idea was successful and the price is now at the support level. We broke the uptrend channel and also formed a triangle during the decline. There are large volumes at the nearest resistance level, so I expect that after reaching the upper boundary of the triangle the price will retest the support level, fixing under it and reaching the next support level.
