NEAR - BREAKOUT!NEAR went very well above resistance.
Except for one false breakout, the Resistance Line has done its job very well.
The price will hit the resistance line again before starting a long term uptrend.
Target in the short term will be: 9.6 - 10.6 - 11.6
The mid-term target would be: 13 - 14.8 - 18 - 20.
Expected price reached at the end of the bull cycle will be: 28 - 42
That is only my opinion!
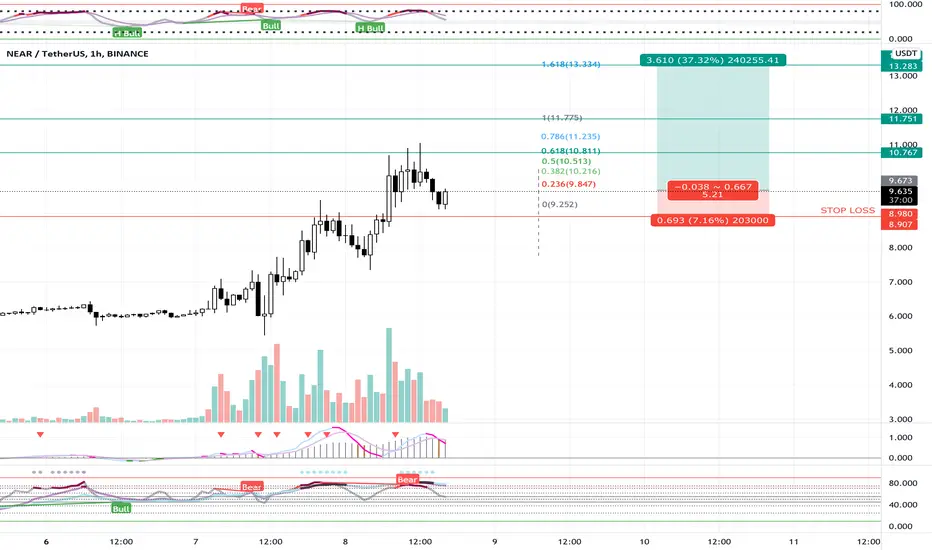
NEARUSD

NEARUSD - bullish flag, NEARBTC - falling wedgeNEARUSD formed a bullish flag.
NEARBTC formed a falling wedge.
Keep an eye in the days.
Support zone at red box.
Just an idea.

The potential double bottom in NEAR 4h In NEARUSDT 4h
At the mark is bullish engulfing but it didn't breakout the bearlish channel yet.
We can wait for breakout in 15m or 1h and SL:7.609
TP1:9.42
TP2:10.258
TP3:10.597
TP4:12.502

NEAR USDT LONG SWING TRADE | NEARUSDT | LONG @ 7.5 - 8 | TP @ 8.5, 9, 9.5, 10, 10.5 | SL @ 6.5 | PATTERN = LOW POLE REVERSAL |
PNF chart on the hourly shows a trend reversal, LOW POLE REVERSAL
The strategies I use involve a mix of PNF and Renko. My type of trading is strictly swing trading.

NEARUSDT ACCURATE PREDICTION?!?Wave seems like a good opportunity to buy in right now, with large buy in orders at near the 5$ range, we could see a 77% jump is to be coming in the NEAR future ;')
This is not financial advice, i love trading as a hobby and would like it if you like and follow


NEARUSDT Good Buy Opportunity!NEARUSDT (Day Chart) Technical analysis
NEAR/USDT (Day Chart) Currently trading at $7.80
In the above chart old resistance zone act as new support.
And price touched 200EMA in 4h chart. EMA act as good support!
Buy level: Above $7.30
Stop loss: $6.30
TP1: $9.60
TP2: $10.50
TP3: $11.80
TP4: $15.00
Max Leverage: 2x
Always Keep Stop loss

Near/UsdtNear/Usdt
entry Now : 7.70 - 8.80
TP 1 : 9.28
TP 2 : 10.24
TP 3 : 11.80
TP 4 : 14.41
TP 5 : 20.75

NEARUSDT ShortReason
1.Wave 5 is over
2.Double top Pattern
3.Try to retest with weak volume
4.Support Channel will breakout closely
5.RSI divergence
Disclaimer ON
this chart is not a signal you should follow, I just want to share what I think, if I made a mistake please let me know in the comments section, Thanks.

NEARUSDT CONTINUESUptrend confirmed. One more leg is possible. Bullish reversal candle posted on 1H chart. Good RR. TP at green horizontal lines
NEAR/USD ForecastThe daily chart shows that yesterday’s melt-up lifted NEAR Protocol above a descending trend line at $6.90. This accelerated the buying, and as a consequence, NEAR cleared the previous all-time of $7.4500. This now becomes the first level of support, followed by the former trend resistance, now seen at $6.85.
How far can the rally take NEAR? Considering the performance against a weaker market backdrop, the price action is definitely positive. Although the parabolic nature of yesterday’s advance has left the market looking a bit stretched. The Relative Strength Index is extremely high, and its 80.10 reading may lead to a correction.
In saying that, as long as trend support holds, the NEAR protocol price looks good. Just how good is hard to say. That depends on how the broader market fares in the coming days. Personally, I think chasing this rally is risky until stability is confirmed.
However, that made no difference yesterday, and if the price manages to clear Tuesday’s $10.45 high, it could well extend even higher. However, a correction is more probable.
Feel free and get in touch for more updates, signals and trade alerts

NEAR near a big breakoutNEARUSDT again near the highs. The more it touches these levels, the more likely it will break out. In the short term it might have a pullback but long term I see it going much higher. Like several other coins it was on that got several high profile listings early on, but didn't have a really big move. Personally I like low profile layer 1 protocols that could get listed on Coinbase and which haven't had huge moves yet.
NEARBTC looking like decent accumulation and the price is mature for a pump. It's definitely looking pretty good to me.

NEARUSDT New ATH Soon!NEARUSDT (DAY CHART) Technical Analysis Update
New ATH soon!
NEAR/USDT currently trading at $5.00
Buy-level: Above $4.70 -$5.00
Stop loss: Below $4.25
Target 1: $5.60
Target 2: $6.00
Target 3: $6.50
target 4: $7.50
target 5: $9.00
Max Leverage: 1X or buy it on the spot
ALWAYS KEEP STOP LOSS...
Follow Our Tradingview Account for More Technical Analysis Updates, | Like, Share and Comment Your thoughts.

NEARUSDTPERP 📈Looks good and juicy! PPO is about to cross, clear indicator, above 50% RSI and crossed. Definitely gonna break.

NEARUSDTNEAR had fully completed 1-5 Elliot waves and now is getting ready for A, B, C correction Elliot waves. Trade safe and DYODD!

NEAROpening LONG for #NEAR here around 1.78$
Max Leverage : 5x/10x
target : 1.82$,1.86$,1.98$,2.2$
stoploss : 4h closes below 1.65$
#NEAR Has now reclaimed the support and Looks ready to take up the recent local highs.


Near in FLIGHT!Strap in, NEAR is in TAKE-OFF! I was wondering when my NEAR was going to take flight. Have been saying all year this is one of the most under rated coins we have on the market. They spent hardly anything on their advertising budget so thats why they didnt get much exposure (or as much as they should have). The team is incredibly brilliant. And have some really intelligent people on their team. this coin also doesnt have the billion plus supply a lot of coins do so really has the potential to fly here in this bull run. I mean were talking 100's and up easily if this coin can get some devs on board to build dapps and take over the ethereum "slowchain" lol . You can sell at the price I have listed then wait to buy back in on the dip or just hold and forget about it until 5 years from now if you're looking for a retirement plan! Cheers!

NEARUSDT Descending Channel BreakoutNEARUSDT(1H CHART) Technical Analysis Update
Descending Channel Breakout
NEAR/USDT currently trading at $5.35
Buy-level: $5.25 - $5.35
Stop loss: Below $4.84
Target 1: $5.60
Target 2: $6.00
Target 3: $6.25
Target 4: $6.50
Max Leverage: 2X
ALWAYS KEEP STOP LOSS...
Follow Our Tradingview Account for More Technical Analysis Updates, | Like, Share and Comment Your thoughts.

NEARUSDT Waiting for the Breakout!NEARUSDT (1H CHART) Technical Analysis Update
NEAR/USDT currently trading at $5.20
Buy-level: Above $5.25 (only buy if 1H candle closes above $5.25
Stop loss: Below $4.98
Target 1: $5.50
Target 2: $5.60
Target 3: $5.75
Target 4: $6.00
Max Leverage: 3X
ALWAYS KEEP STOP LOSS...
Follow Our Tradingview Account for More Technical Analysis Updates, | Like, Share and Comment Your thoughts.

NEAR is near a big pumpOne of the newer L1 platforms, one I think will also be listed on Coinbase at some point. Fairly strong and looking good here. Trend is very clean and hasn't had an major issues. Nice consolidation ready for expansion

+330% incoming ... consolidating for a great breakout 🚀we can see that near is consolidating in horizontal channel and we can see that the price were bounced from the resistance and hadn't managed to breakout.
wait till the buy price it is more than profitable trade, near is a good investment for long term if it caught at that price, believe me near is a coin which can be $25 in 2021 or 2022 easily
✅ Buy: 3.25 - 3.75 ✅
🎯TARGETS:
1- $7.500
2- $9.744
3- $13.27
💵 Trade Size: 5-7% of Portfolio
🚫Invalidation(SL): daily candle close below $2.59
Please click LIKE button and Appreciate my hard work.
Must follow me for latest crypto real time updates.
Thank you.
