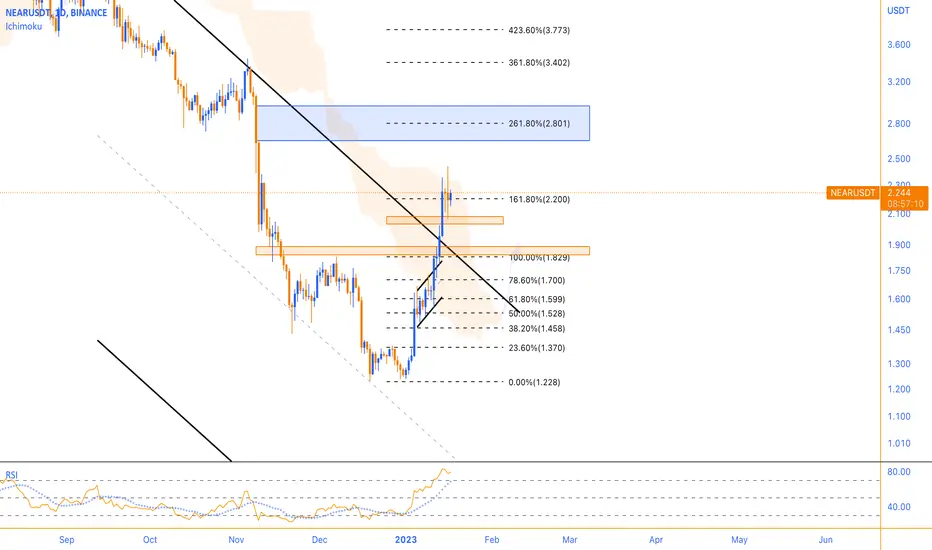
NEARUSD Attempting the first 1D MA200 test in 9 months!The Near Protocol (NEARUSD) is at the closest it has been to the 1D MA200 (orange trend-line) in more than 9 months as there hasn't been any contact since May 05 2022. Even in the event of contact or even marginal break-out, it is not the time to celebrate as within the Bear Cycle's Channel Down (since January 14 2022), there have been another two similar occasions that both started on a Higher Lows bottom but failed to break above the Resistance Zone formed by the previous Lower High of the bearish leg.
That is currently a little below the 0.382 Fibonacci retracement level. In order to extend our buying, we need to see a break above the top (Lower Highs trend-line) of the Channel Down, in which case we expect the price to fill the upper Fibonacci levels one by one.
Note that the 1D RSI invalidating a Bearish Divergence is a positive sign.
-------------------------------------------------------------------------------
** Please LIKE 👍, FOLLOW ✅, SHARE 🙌 and COMMENT ✍ if you enjoy this idea! Also share your ideas and charts in the comments section below! **
-------------------------------------------------------------------------------
💸💸💸💸💸💸
👇 👇 👇 👇 👇 👇
NEARUSD

NEAR ROADMAPHi, I hope you are well and have been profitable.
Examining the waves, I realized that we are completing wave B of a larger structure, actually B of B. The expectation that we will move down from one of the two announced ranges
Comment if you have any questions
Thank You

The Singularity is Near +1000%I started buying at a price of 2 dollars.
This morning was considering this project for long-term investment and decided to increase the share of my capital in this project.
A few hours after the purchase, the news appeared that NEAR will develop in the direction of artificial intelligence. And this is a very important direction today.
I would like to remind you that one of the founders before the creation of the NEAR blockchain worked for a long time in the field of artificial intelligence, so I am confident in the successful growth of this project in the long term.

What is NEAR?What is NEAR?
NEAR is an L1 blockchain that uses Nightshade, a unique segmentation technology, to achieve scalability. It was launched in 2020 as a decentralized cloud infrastructure to host decentralized applications (DApps).
NEAR offers interconnectivity through Rainbow Bridge and the L2 Aurora solution. Users can transfer ERC-20 tokens and assets from Ethereum to NEAR, giving them access to higher bandwidth and lower transaction fees.
Aurora is an L2 blockchain, the Ethereum Virtual Machine (EVM) created by the core developers of the NEAR protocol. It operates as a smart contract on NEAR, providing benefits such as Rainbow Bridge connectivity, high bandwidth and low transaction fees in ETH. Aurora is available through various bridges including Allbridge, Axelar, Rainbow Bridge and others.
Details on all ecosystem projects can be found here
Top largest projects in Aurora by number of accounts: Aurora, Ref Finance, Stader.Near.
awesomenear.com
Current performance of the NEAR blockchain:
700+ projects (including those under construction)
125 DAO
550 thousand participants
4k+ developers
865 knots
20 million wallets
250 million transactions were made in 2022
The current TVL of NEAR+Aurora is about $160 million.
Current TVL NEAR is $85M
TVL peaked at $500M in May 2022.
The main Defi project is Ref Finance.
Aurora's current TVL is $72 million.
TVL peaked at $1.3 billion in May 2022.
The main Defi project is Bastion.
How much was invested?
According to known information, about $533 million were invested in NEAR.
Current capitalization is $2.15 billion.
Total capitalization is $2.5 billion.
There are 85% of tokens in circulation.
The current price of NEAR is $2.51. The price has fallen 88% from the highs.
What is the NEAR token
The NEAR blockchain has its own asset for its ecosystem - the NEAR token.
The NEAR token is the primary asset of the NEAR ecosystem, and its functionality is available to all accounts. Each token is a unique digital asset that can be used for:
1.Paying for transaction processing and data storage.
2.Launch a validation node (by participating in the stacking process).
3.Participate in voting.
The NEAR token provides economic coordination for all participants who run the network, as well as providing new behavior for applications built on that network.
NEAR development activity
Among the largest ecosystems (Polkadot, Ethereum, Cosmos, Aptos, Chia), NEAR is holding steady with Chia, ranking fourth for the past year.
At the same time, the level of development holds about the same level.
Development activity - shows the project's development activity over time based on a number of purely development-related "events" in the project's publicly accessible Github repository. (does not take into account: release comments, forks, stars, etc.).
How NEAR works. Functionality
NEAR aims to compete with other platforms with its segmentation/sharding solution called "Nightshade".
Let's take a look at the functionality that the NEAR protocol provides.
Plans for 2023-2024
Since the launch of Mainnet in late 2020, the NEAR ecosystem has made great progress, becoming one of the top-tier blockchains with 22 million accounts, 600,000 active wallets per month (2+ transactions count as active) and 15x growth in users and projects.
Last year, despite market chaos and a major downturn in recent months, the NEAR Foundation has enough capital to sustain at least five years of operations in a bear market thanks to responsible treasury management.
The NEAR Foundation believes that NEAR is the only ecosystem in which the promise of Web3 can be realized and where mass adoption can occur.
The roadmap covers major efforts to improve the scalability and decentralization of the protocol.
Phase 2 and 3 blockchain segmentation
The next step of the deployment is Phase 2 segmentation, which will completely separate state and processing, further reducing hardware requirements for segment validators, making the network more accessible to validators. Phase 2 is expected to begin in 2023. This upgrade will increase the capacity of the network from 4 to 100 segments, with the validators not tracking all segments.
Phase 3 segmentation will involve dynamic redistribution - the network will be dynamically divided into segments, and then the segments will be combined based on resource usage. This will allow NEAR to expand almost indefinitely. Phase 3 is expected to begin in 2023-2024.
Conclusion
For 2022, blockchain NEAR has tried to keep a constant level of development, roughly on par with Chia.
NEAR strives to create the most user and developer-friendly ecosystem possible.
Users are being offered the full suite of cheap and fast transactions, simple addresses, instead of public key hashes. In 2023, Iphone owners will be able to use NEAR as easily as possible, without having to create a separate wallet. A focus on simplicity and mass.
Developers are offered a toolkit that allows for "one-click" app deployment wherever possible. They also lowered the entry barrier as much as possible by offering the use of the Javascript SDK.
Segmentation/sharding technologies, with overall security in mind (like Polkadot) suggest that this is a very balanced blockchain.
This is reflected in the highest $500+ million investment.
Ease of use, balanced technical solutions, unlimited blockchain scalability, very large investment, collaborative developments with Apple - this is a good bid for the first blockchain with mass use!
Thank you Smart Investor
Best regards EXCAVO

NEARUSD ❕ above the liquidityNEAR continues to trade above the support level.
The price bounced three times from the current level.
I think that the price will start a new growth impulse after fixing above the channel.

NEARUSDT IdeaNEAR Idea | NEARUSDT NEAR PROTOCOL
✅ ✅ Risk warning, disclaimer: the above is a personal market judgment and analysis based on published information and historical chart data on The trading view,
And only some of these analyzes are my actual real trades.
I hope Traders consider I am Not responsible for your trades and investment decision.

NEARUSD ❕ is getting ready to go upTrading volumes have increased and indicate the market's interest in price growth.
NEAR has broken up 200EMA (1H TF).
I think the asset may resume growth.

Previous floorAs long as the previous floor is not broken in the $2 range, we expect resistance to be retested.

NEARUSD ❕ hold the trend linePrice has consolidated above 50EMA (4H TF)
RSI is in the buyers zone (4H, 1H and 30m TFs)
I expect the price to continue to rise.

✅TS ❕ NEARUSD: above the liquidity✅✅ NEAR is committed to the support area.
The price is trading above the liquidity.
I think the price will bounce off the support. ✅
🚀 BUY scenario: long to the resistance area. 🚀
----------------------------------------------------------------------------
Remember, there is no place for luck in trading - only strategy!
Thanks for the likes and comments

NEARUSD ❕ descending wedgeNEAR is trading above liquidity.
Trading volumes have increased significantly.
The price has consolidated above 50EMA and went down to the middle of the BB indicator (4H TF).
The 1H Timeframe up reversal signal was formed.
I expect the price growth.

NEAR/USDT. BitVero Crypto Academy.
Disclamer:
We are not financial advisors. The content that we share on this website are for educational purposes and are our own personal opinions.

NEAR has maintained a strong uptrendNEAR has maintained a strong uptrend over the past week, and buying support has led to a break above the long-term descending channel ceiling and static resistance at $1.75. The next resistance in the $2.03-$2.08 range was exactly followed by a reaction on both sides and has now become a good support. But the second support is considered in the range of $1.84 to $1.89, which is a more reliable range. This strong bullish wave could form once again, and if there is a pullback and a positive reaction to the supports, we expect a rally to the $2.65-$2.96 range. There is strong potential for a price reversal in the daily time frame, and if Bitcoin holds its support, NEAR could take a mid-term bullish trend.
NearusdtForming Falling Wedge In daily Timeframe Counter Trendline already Broken Expecting test Of Main Trendline Area (1.78 to 1.85)
If Wedge Got Cleared Too Then Expecting Move Toward 3.50 to 3.70
Safe Stoploss Would be Below Last Low Its Only Idea Not Financial Advice

NEAR | Fueling up for Massive Breakout..!!
#NEAR Falling Wedge formation in Weekly timeframe..
Massive Buying Volume Coming in..
Expecting Breakout Soon..
+450-500% Profit Potential in the Midterm.. ✍️
Please like the idea for Support & Subscribe for More ideas like this and share your ideas and charts in Comments Section..!!
Thanks for Your Love & Support..!!

$NEAR #NEAR | LTF LONGGreen box and EQ might be worked as a support level .
The bottom of the red box, liquidity zone and around 1.9 will be the points I will observe as resistance.
With the loss of 1.7 (1H) , the first bounce of the price will be around 1.55 .
I wish everyone a good week.

🔥 Why Near Protocol coin is falling? 👇Today we will talk about Near Protocol
The last 4 months have been somehow catastrophic for the NEARUSDT price. After all, during November, Near depreciated twice from $3 to $1.5, and since August 4 times from $6 to the current $1.5.
One of the reasons that encourages investors to get rid of their Near can be called that the structures of Samuel Banckman-Fried (FTX and Co) own a total of 17 million NEAR tokens. In case of bankruptcy, they are subject to liquidation. That is, they will be transferred or sold to someone. However, NEAR has insurance against the simultaneous sale of coins - most of the tokens owned by FTX will be unlocked within three years.
This reason at least somehow explains the NEAR drain in November.
But why NEAR was drained in large amounts before, we do not know. Did the "big wallets" know about the impending troubles in the crypto world much earlier?
Write what you think about it in the comments below the idea.
The other day, the price of NEARUSD easily updated the minimum from 2021, without any problems, and without the volume of the struggle between buyers and sellers.
Well, now we can only assume in what format the downward trend of the NEARUSDT price will be able to reverse.
As an option, a long formation of the "Inverted Head and Shoulders" reversal pattern is possible. Potentially, the formation fits the technical description of the pattern, as well as the volumes that decrease from the left shoulder to the Head.
Now the price of NEARUSDT is above the liquidity level of $1.25-1.50, there are chances that it may not go lower. And then the long growth of the NEAR price to the $5 area, where every trader and hodler should think about it: "Is it worth keeping this asset "?
_____________________
Did you like our analysis? Leave a comment, like, and follow to get more

✅TS ❕ NEARUSD: mirror area✅✅ NEAR is moving in an uptrend.
The price is testing the mirror support area.
Rapid growth is possible. ✅
🚀 BUY scenario: long to 1.685. 🚀
----------------------------------------------------------------------------
Remember, there is no place for luck in trading - only strategy!
Thanks for the likes and comments.

NEARUSD ❕ correction endsOn the price correction the trading volumes decreased.
Price is testing 200EMA as support (4H TF)
RSI chart is trading in the buyers zone (4H TF)
TD Sequential has formed an up reversal signal (1H TF)
Price will rise once it overcomes the resistance level.

$NEAR #NEAR |LTF SHORTThe lower bound of red box most probably will work as resistance so i looking at bearish breakers around $1.6. If the price loses red box, the price may dump more than we expect.
Have a nice week!

✅TS ❕ NEARUSD: resistance level✅✅ NEAR reached the resistance level.
Price has formed long upper shadows.
Decline is possible.✅
🚀 SELL scenario: short to 1.37.🚀
----------------------------------------------------------------------------
Remember, there is no place for luck in trading - only strategy!
Thanks for the likes and comments.

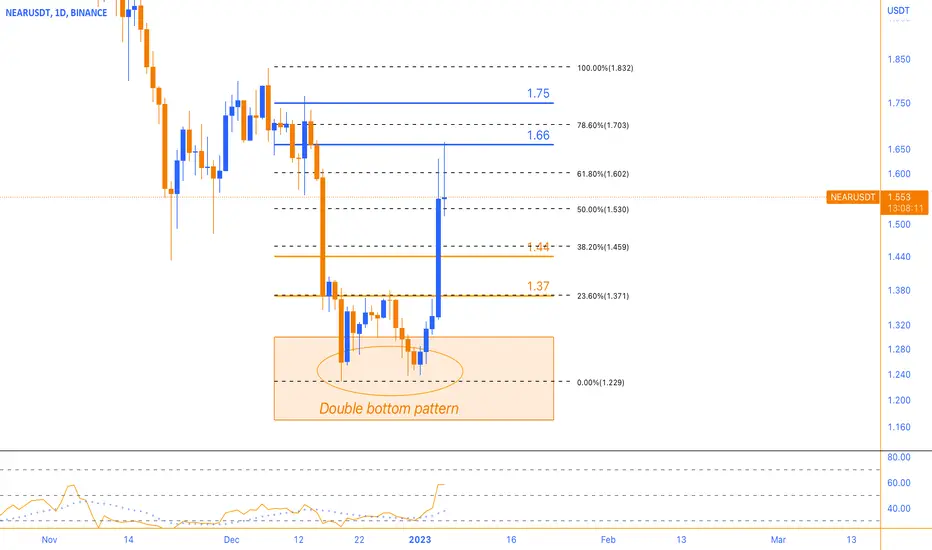
Double bottom patternNEAR has registered a 16% price growth in the past day. Its price has formed a double bottom pattern on its support level in the range of $1.30 to $1.17. Confirmation of the pattern by breaking the $1.37 range caused the NEAR pump and price growth to the $1.66 range. This strong reversal can become a trend reversal wave in the daily time frame. But it has made the 4-hour time trend upward. Therefore, in the 4-hour timeframe, pullbacks towards the support of the $1.37 to $1.44 range can be associated with a positive reaction. Therefore, after the pullback, we can expect another upward movement to the range of $1.75.
NEAR Protocol Analyze (Road Map)!!!🗺️(+250%😱)❗️❓Today, let's look at NEAR Protocol's road map🗺️.
What Is NEAR Protocol (NEAR)❗️❓
NEAR Protocol is a layer-one blockchain that was designed as a community-run cloud computing platform and that eliminates some of the limitations that have been bogging competing blockchains, such as low transaction speeds, low throughput and poor interoperability. This provides the ideal environment for DApps and creates a developer and user-friendly platform. For instance, NEAR uses human-readable account names, unlike the cryptographic wallet addresses common to Ethereum. NEAR also introduces unique solutions to scaling problems and has its own consensus mechanism called “Doomslug.”
NEAR Protocol is being built by the NEAR Collective, its community that is updating the initial code and releasing updates to the ecosystem. Its declared goal is to build a platform that is “secure enough to manage high value assets like money or identity and performant enough to make them useful for everyday people.”
Flux, a protocol that allows developers to create markets based on assets, commodities, real-world events, and Mintbase, an NFT minting platform are examples of projects being built on NEAR Protocol.
----------------------------------------------------------------------------------------------------------------------------------------------------------------------------------------------------------------
NEAR Protocol is running on descending channel for about one year.
Also, If we look at the NEAR Protocol by Elliott waves theory. It is running on microwave 4 of microwave 5 of main wave A.
I tried to show you the end of main wave A in my chart.
🔆Suggestion: If you want to add NEAR to your portfolio, you can wait to break the upper line of descending channel or when NEAR touches my target(zone) for the end of main wave A.
NEAR Protocol Analyze ( NEARUSDT ) Timeframe Daily⏰ (Log Scale).
Do not forget to put Stop loss for your positions (For every position you want to open).
Please follow your strategy, this is just my idea, and I will be glad to see your ideas in this post.
Please do not forget the ✅' like '✅ button 🙏😊 & Share it with your friends; thanks, and Trade safe.
