Is NEAR chasing a new ATH?Hello everyone!
The #NEAR cryptocurrency has already brought us good profits last year. I suggest you consider entering a trade at this point.
At the $6 level, we have a strong support zone that is clearly visible on the chart.
You can open a position from the current price levels, or you can also place another buy order around $6 just to be safe.
The main target is $12.48. You can also set sell orders at all the important Fibonacci levels:
$10.85
$9.43
$7.92
I believe that the asset may continue to move above these levels.
This is not financial advice, and all trading is done at your own risk!
Follow me to receive more trading ideas.
NEARUSDTPERP

3 possible scenarios for NEAR price movement in the coming monthDo you think that yesterday's "shaking out" of positions was at the same time a necessary correction to continue growth?
Or can and should the NEARUSDT price still correct to before continuing to $2.5 grow to $10?
Or maybe it's "game over"? NEAR price growth cycle over and a deep correction to the $1.5 area ahead?
Vote in the comments which scenario you prefer, or write your own version.
_____________________
Did you like our analysis? Leave a comment, like, and follow to get more

#NEAR/USDT#NEAR
The price is moving in a descending triangle on the 12-hour frame
We have a commitment to the boundaries of that triangle
Now the triangle is about to break upward, as well as the Moving Average 100 breakout
We have buying momentum on the MACD indicator
Entry price 2.93
First goal 3.32
The second goal is 3.65
Third goal 4.10

NEARUSDT SHORT POSITIONThe price is completing head & should pattern and I expect to bearish movement also the R/R is reasonable for me

near/usdtWe previously discussed NEAR/USDT and its potential gains. Since our last post on( December 14), NEAR has surged by over +50%. Now, we're presenting another opportunity to enter #NEAR with a potential of 4000% using 10x leverage.
Entry Range: $2,162 - $3,266
stoploss: $0.93
Take Profit 1: $5,764
Take Profit 2: $10,425
Take Profit 3: $16,231

NEAR Zone of interestRed box are the resistance are for NEAR. If it can broke the first resistance zone at 3, i think it can surge at least till second zone at 3.20. There we will see if it can continue the pump or if it will make a strong pullback

Near Do or Die Situation?Near can push higher from here.
Entered heavy leveraged long from 2.879.
Tight sl at 2.863
It have to claim this major resistance without any down moves or it's over for it so taking risk is okay here.
If it holds it it can push to 4 and 5.

NEAR | Converging VWAPS and Trendline | A Big Move Coming?BINANCE:NEARUSDT BINANCE:NEARUSD
Hit the rocket! ---------------------------------------------------------------------------------------------------------------------------------------------------->>>>>>>>
The oversold line (green) from the most recent high is converging with the overbought line (red) of the most recent relevant low.
This also coincides with the trend line which coincides with the psychological price of $3 so expect the bulls and bears to fight a bit around $3 with the bulls eventually winning.
Crypto is volitile and easily manipulated. Caveat emptor. Playing with colored lines on a chart is Not Financial Advice .

NEAR long updateAMEX:NEAR went through SL in my sleep. Decided to re-enter this morning on trendline...
#trading
@NEARProtocol

NEAR/USDT TRADE SETUP! #NEAR:
Entry Point:
Buy at CMP: Consider entering the trade at the Current Market Price (CMP), taking advantage of the current market conditions.
Additional Entry: Be prepared to add more positions if the price drops to $3.34. This level is identified as a potential strategic buying opportunity.
Target Prices:
Set specific target prices at $3.52, $3.6, $3.78, $4.01, and $4.2. These levels represent potential profit-taking points as the price moves upward.
Stop Loss (SL):
Set a stop-loss at $3.236. This level is chosen to limit potential losses and effectively manage risk.
Leverage:
The recommendation advises maintaining low leverage and entering the market at the lowest possible price. It suggests a gradual entry approach and encourages traders to avoid sudden decisions. Using leverage cautiously is crucial to minimize risk.
Cautionary Note:
Reminds traders to do their own research (DYOR) before making any trading decisions. This reinforces the importance of conducting personal research for informed decision-making.
Includes "NFA" (No Financial Advice), emphasizing that the provided information is not a recommendation for financial decisions.
In summary, the recommendation outlines a trading strategy for #NEAR, providing specific entry points, target prices, and a stop-loss level for risk management. It emphasizes caution with leverage, gradual entry, and the necessity of conducting personal research. As always, the information is not financial advice.

NEAR Near is currently heading towards the support area.
The weekly support will be the best spot for bull market, make sure to buy some in that area.

For this best zone (NEAR)📊Analysis by AhmadArz:
back to break of trendline & candle of bullish.
🔍Entry: 3.66
🛑Stop Loss: 4.48
🎯Take Profit: 3.80 -4.48
🔗"Uncover new opportunities in the world of cryptocurrencies with AhmadArz.
💡Join us on TradingView and expand your investment knowledge with our five years of experience in financial markets."
🚀Please boost and💬 comment to share your thoughts with us!

NEAR USDT Short PositionEverything mentioned in the chart
Do Proper Risk Management - You are the only one responsible for your trades
“Greed, in the end, fails even the greedy.” - Catherynne M. Valente

NEAR Protocol NEAR Coin Price PredictionNEAR Protocol NEAR Coin Price Prediction
🔥 Price on the 4H chart might come at these support area and we might get a potential bounce🔥
Potential bounce areas for Buying 2.614 and 2.182
👉 Follow me for More Real Time Opportunities.
Share your Thoughts if you have any?

TRADING MASTERCLASS 101Today i explained to you guys the basics of the luftwaffe strategy and how to trade when you see a LUFTWING candle. Thanks so much for your time guys...

Long-Term Price Analysis for NEAR Coin!#NEAR
The range we have been waiting for long-term spot buying for NEAR coin is between $1.415 and $1.32. When NEAR coin reaches the zone indicated as blue lines in the analysis, it will have completed a retest move to the trend support.
If NEAR coin initiates an upward movement from the $1.415 - $1.32 range, our target for the upward trend is the $2.20 region.
Our initial purchase for NEAR coin will be at the $1.415 level, and we are placing our second buy order at the $1.32 level.
NFA.

NEAR: UP or DOWN ?
Near had a significant price correction recently and currently it is trying to establish it support level
We can expect this price uncertainty to continue for a while as shown in the above chart.
With the current bullish market sentiment we can expect NEAR price to bounce back.
Im expecting price to move up once it settles in the support zone.
We will keep you posted about our trade entries. Stay tuned
Like and share your thoughts in the comments.
Cheers!
GreenCrypto

I expect NEAR to rise to $2.12Hello everyone! I have a great idea regarding NEAR.
With the recent upward movement, NEAR has broken out of the accumulation zone, surpassing the first major resistance level, as well as the nearest strong Fibonacci level of 0.236 and the 200-day moving average (EMA 200).
Currently, the asset is within another range of resistance/support, and in a bullish market, it should easily overcome this level.
I believe that the asset is currently in a good range for buying opportunities.
On the chart, the blue horizontal lines indicate other areas of resistance/support for the price.
My final target is a growth up to the 0.618 Fibonacci level, which would bring a profit of 41%.
I also see the possibility of further upward movement towards $2.4 and $2.7.
All targets are shown on the chart.
Please note that this is not financial advice, and any actions you take are at your own risk!

NEAR / NEARUSDTGood Luck >>
• Warning •
Any deal I share does not mean that I am forcing you to enter into it, you enter in with your full risk, because I'll not gain any profits with you in the end.
The risk management of the position must comply with the stop loss.
(I am not sharing financial or investment advice, you should do your own research for your money.)

NEAR updateAMEX:NEAR update...
First attempt failed, this is my second attempt... If this trade is also stopped I'll wait for confirmations around ~1,55...
Be safe...
#trading
@NEARProtocol
#Near #NEARProtocol #altcoins

Last support range: 0.830-1.528Hello?
Hello traders!
If you "Follow" us, you can always get new information quickly.
Please also click “Boost”.
Have a good day.
-------------------------------------
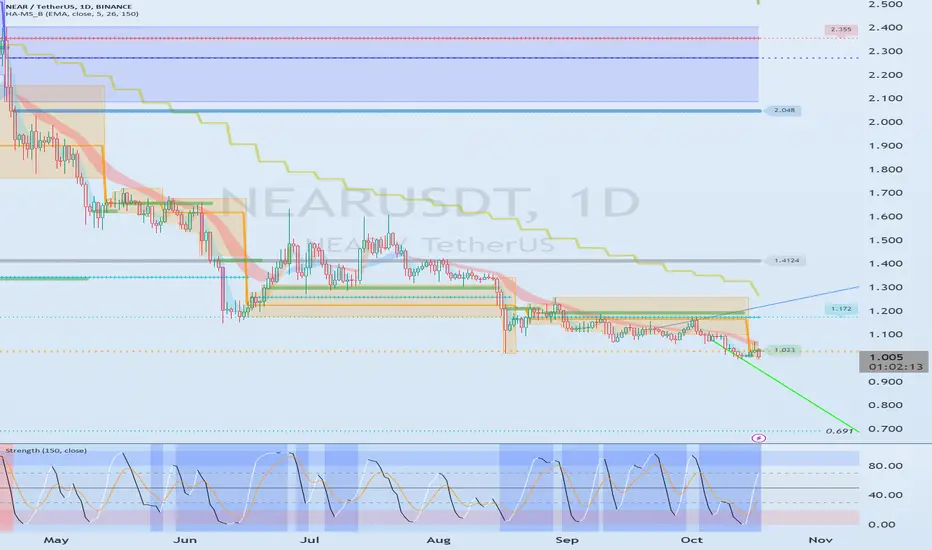
(NEARUSDT chart)
(1M charts)
The key is whether the price can be maintained by rising above 1.99.
(1W chart)
The key is whether it can receive support and rise in the 0.830-1.528 range.
(1D chart)
Since the volume profile section is formed around 1.4124, the key is whether it can rise beyond this point.
If the price cannot be maintained by rising above 1.031, there is a high possibility of a new low, so caution is required.
-------------------------------------------------- -------------------------------------------
** All explanations are for reference only and do not guarantee profit or loss in investment.
** Trading volume is displayed as a candle body based on 10EMA.
How to display (in order from darkest to darkest)
More than 3 times the trading volume of 10EMA > 2.5 times > 2.0 times > 1.25 times > Trading volume below 10EMA
** Even if you know other people’s know-how, it takes a considerable amount of time to make it your own.
** This chart was created using my know-how.
---------------------------------
Near price comes to life!) Holders have been waiting for you)NEAR price has dropped back into the $1.20-1.30 liquidity zone
At the beginning of its trading, NEARUSDT, after breaking through this liquidity zone, began a solid and solid price growth.
In 2023, the NEARUSD price is testing this level for the third time, which is probably a strong mirror zone.
The only nuance is that in six months of 2023, the price of BTC roughly doubled from $15k to $30k, while the price of Near did not.
Therefore, keeping our fingers crossed for NEAR, we can assume that if buyers manage to hold the $1.25 level, they should be able to double the NEARUSDT price to $2.75 just to catch up with the amplitude of BTC's growth.
However, if NEARUSDT drops and consolidates below $1.20, then it's nothing personal, but the next stop from the bottom is $0.90.
_____________________
Did you like our analysis? Leave a comment, like, and follow to get more

NEARUSDT may be ready to drop to next weekly support 0.95-1.05The price broke down from weekly support on the last drop a week ago and closed below it. This week it has moved up and almost touching the broken support zone. However, it does not seem like it is going to move up and claim this support. A few hours are left and if that happens in these few hours than it will be bullish and the price will be ready to move up towards the weekly resistance WR1. But from current price action it seems likely that the price may be getting ready for a drop towards weekly support WS2 which is sitting around 0.95-1.05.
