Time for Centamin to reverse?Inverse H&S pattern formed on CEY which started in May 2018.
Reasonable results today and gold in a strong position. Will it go further?
Neckline

Daily Chart of Nifty Pharma Index@jagrut
Daily Chart of Nifty Pharma Index:
It seems that the index is on verge of completing its bearish phase which was started from April-2015.
It seems the index is forming an Inverse Head & Shoulder pattern in strong downtrend.
The index is forming a Right shoulder with Neckline of the pattern lies around 8600.
The index has to close above the levels of 8600 for Inverse Head & Shoulder pattern to complete.
View negated if the index starts to trade below the levels of 7450 which is the low formed on 02/03/2020.
7500 to 7700 levels has acted as strong demand zone for the index.
For educational purpose.

CADJPY Potential Bearish MovementCADJPY Potential Bearish Movement
we are waiting for a momentum candle close below 82.60 to sell this one
Reason:
1- Regular Bearish Divergence on MACD (in red)
2- Objective Wedge Pattern (in blue)
3- Objective Double Top Pattern (in blue)
Three confluences are enough to consider Selling CADJPY, after a break below 82.6 (in gray)

ESNT more like, DSNTLooks like break of a neckline on a weekly and daily chart. A sloppy head and shoulders. Symmetry support held at $48.15 this morning after earnings, but my dowsing suggests selling rallies with a trend reversal, and that ESSENT is in DESCENT.
2 Bar daily squeeze likely to fire short, and I expect downward pressure on indexes, so this looks like the beginning of a downtrend.
I wouldn't want to see it close above it's 20 period daily MA (now at 51.30), but stop at $52.
Entry anywhere under there.
Hold ~9 weeks. Target $34.38 area

Head and shoulders at H4 NZDUSDWe're currently seeing H&S formation at the NZDUSD pair.
If the price break the neckline, we expect up movement with the size of the head.
Potential rise to 0,6560
The model collapses at 0,6380

{SWC}——MCLEAN, Volume Triggered
Strategy: PVA
Bias: Bullish.
Traded earlier with private and public group members at low since RM0.170. Congrats everyone who followed and profited :)
Yesterday, strong reversal from RM0.190 and formed bullish engulfing. Discussed in private message with private group member regarding this potential reversal exactly one day earlier :)
Gap up with volume, next to potentially challenge further neckline at RM0.270 provided momentum sustained.
Kindly take note that Chinese New Year is coming and the market would have less involvement by market participants.
S: 0.230, 0.210
R: 0.270
If you found this idea helpful, do not hesitate to drop us a like and comment! :)

{SWC}—— Pelikan, Uptrend Continuation ?Thank you for your continued support :)
Strategy: Price Volume Analysis
Bias: Bullish, Pelikan was hot stock traded in the past two weeks where it recorded a sharp rise. After a correction with diminished volume in past 2 days, today Pelikan was once again traded actively with significant volume, momentum generated brought price back to recent high 0.535.
#Pelikan was first given to private group student as early as RM0.305 and follow up was done at RM0.375, 10 Jan 2020, right before the gap up big spike. Today private group students were informed when Pelikan broke above immediate resistance RM0.515 and up to RM0.535 intraday :) Congrats
#Do take note that the Share Price has surge a lot. Remeber to take care of the risk before the return :)
With the regain of significant volume and surge in price, SWC believes there will be a positive movement of share price if the momentum and volume sustained.
Immediate resistance: 0.535
Immediate support: 0.495
#It needs to break above immediate resistance in order to have more potential.
If you find this idea helpful, kindly drop us a like and leave your comment! Happy trading, Happy Chinese New Year :)

DJI - Intraday (Possible) LongWe think market could go up after breakout of H&S pattern. Only in this way, so we need to wait for this. Possible trade with very good RRR.

NZDUSD for buy ( 0.6450 )we have a head and shoulders at daily frame
i'm looking for buy from 0.6450 after pullback to the neck line , the main target for this pattern it will be at ( 0.6660 )

Ashtead Group long Reverse Head and Shoulders pattern formed showing two necklines one horizontal - neckline 1 - and one diagonal -neckline 2 - giving two different levels for closing long positions first at 2580 and second at 2640

BTCUSD Inverse Head and Shoulders!| Staunched Resistance!Hello Traders!
Quick update on bitcoin, we have a potential inverse head and shoulders coming to fruition, Bitcoin needs to break its neckline which is a staunched resistance.
Points to consider,
- Clear resistance/ neck line
- Stochastics projected upwards
- RSI in upper region
- EMA’s yet to meet price
- Volume increasing
The inverse head and shoulders formation is a bullish pattern, which is confirmed by a break of its neck line. Bitcoin right now has a stanched neckline/ resistant level that has been tested 5 times.
The stochastics right now is projected upwards, can trade in this area for an extended period of time. RSI is also in upper region but has not officially entered into overbought territory. The EMA’s are yet to meet price, it needs to hold Bitcoin support when it approaches the resistance level. Bull volume has been increasing, which is healthy in this pattern, it needs to sustain in order to successfully break resistance…
The technical target of this inverse head and shoulders is approximately at $8180 mark.
What are your thoughts on these recent developments?
Please leave a like and comment! :)

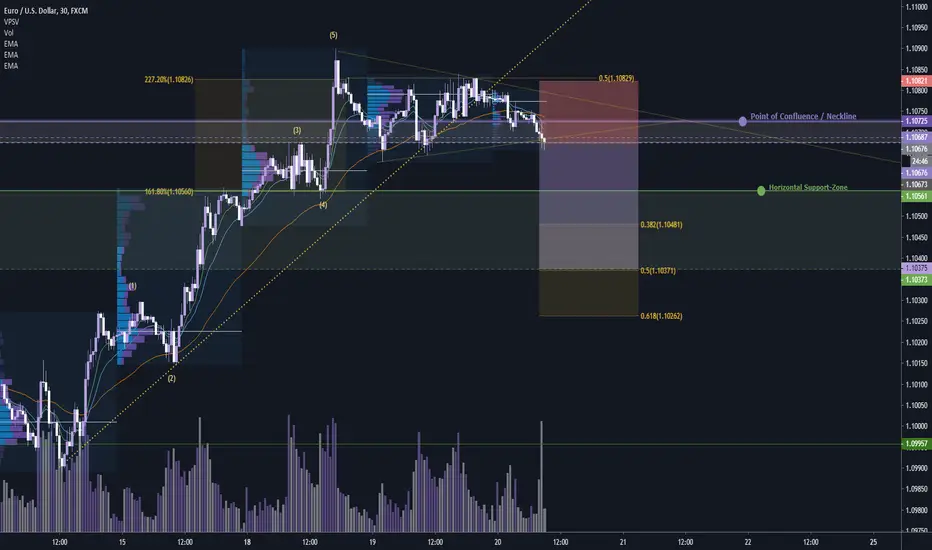
EUR/USD: Daytrade-Opportunity#SELLHey tradomaniacs,
welcome to another free signal!
Important: FOMC Meeting Minutes this evening.
Manage your risk accordingly.
-----------------------------
Type: Daytrade
Market Sell: 1,10670
Stop-Loss: 1,10820
Target 1: 1,10560
Target 2: 1,10480
Target 3: 1,10375
Stop-Loss: 15 pips
Risk: 1-2%
Risk-Reward: 2,0
-----------------------------
LEAVE A LIKE AND A COMMENT - I appreciate every support! =)
Peace and good trades
Irasor
Wanna see more? Don`t forget to follow me.
Any questions? PM me. :-)
XRP - SHORT - Double TOP with 12% TARGET! ENJOY!!!ONCE A 4H CANDLE CLOSE UNDER THE NECKLINE, THERE WILL BE THE CHANCE TO OPEN A SHORT POSITION WITH A TARGET WITH 12% OF GAIN.
LET ME KNOW WHAT YOU THINK ABOUT!
ENJOY !!!

NZDUSD Analysis: Retest of inverted head and shoulders necklineHi traders , from my point of view I see a very clear inverted head and shoulders reversal pattern on this pair.
The price after rising higher fell down to retest the neckline and seem to respect it.
I see high chances of price rising higher up to 0.67097 but may stagnate at the indicated levels.
I would appreciate your views on the pair in the comments section. If you agree with the analysis please hit the like button to help reach more traders.

DOUBLE TOP SHORT CONTprice currently on neckline, breaking out of this area i doubt will be straight forward , 1 of two things , price will retrace back to resistance showed on chart and break downwards (where the first sell might take place) , if price breaks neckline immediately, initiate sell , smart stops should be placed , a bit above neckline so you don't get stopped out straight away in case neckline is retested for RES.
(SUGGESTION) go down to 4HRS to get a better perspective of the retests and early entry opportunity , GO TO WEEKLY to understand whats going on long term(Clean DT setup if daily is not so convincing)
(gold is gold,no feelings involved)

CADCHF Short/Sell IdeaCADCHF Short/Sell Idea
waiting for a momentum candle close below 0.7520 to sell this one
Reason:
1- Regular Bearish Divergence on MACD (in red)
2- Channel Pattern rejection (in blue)
3- Resistance/Supply zone (in light-blue)
4- Double Top pattern (in red and purple)
Four confluences are enough to consider Selling CADCHF, after a break below 0.7520 (in gray)

AUDUSD Long/Buy IdeaAUDUSD Long/Buy Idea
waiting for a momentum candle close above 0.6780 to buy this one
Reason:
1- Regular Bullish Divergence on MACD (in red)
2- Channel Pattern (in blue)
3- Inverse Head and Shoulders Pattern (in orange)
4- Demand Zone (in red)
Four confluences are enough to consider Buying AUDUSD, after a break above 0.6780 (in gray)

Gold Sell IdeaH4 - Hidden bearish divergence right at the retest of the broken neckline of the head and shoulders pattern.
H1 - Price has reached a critical zone, potential bearish divergence.
We may now look for bearish setups with more bearish evidences in order to join the bears.

Total 2 h&s going down to test the h&s necklineThe total2 h&s pattern has a perfectly level neckline and price action is now going down to test it right now. I will not be bullish or bearish on the overall market until I see it confirm either a breakdown or fakeout from this pattern. I think whatever happens on this pattern will likely give us a heads up on which direction bitcoin is going to ultimately head. In the shorter timeframes the bears are definitely in control here but the bigger time frames are still a tossup. If I see a fakeout occur on the neckline of this total2 h&s pattern I will likely ladder in small amounts of a few different alts. Not financiaL Advice just my current plan. If it confirms a breakdown then 8.5k and possibly lower on btc becomes very probable.

GOLD H&S Forming!!GOLD formed a 4-hour double top , on the daily we see that the double top is part of a Head and Shoulder pattern forming on the daily, once price retests the double top neckline, forming the second head, I have placed a trade setup to the next area of support!!

A few signal on EURGBPCrossing MA, Head&Shoulders, retest. We have a lot signal here, i recommend to short this pair the next few days.

EURGBP HEAD AND SHOULDER ADVANCED PATTERN FORMING 4HOURPrice action in the hourly time frame is showing us that we have a highly probable Head and Shoulder Pattern forming. The way we execute in this Bearish Market, would be to wait for the breakout of support which is our Neckline. Waiting for Bearish Reversal Confirmation at the pullback of previous structure then executing ourselves into the market after the Conditions in this pair give us reason to enter. Risk to Reward is Optimal for this Trading Idea.

H&S completed and Fevertree is now bearishOn Jul 9th price broke below the neckline. Yesterday retested the neckline and was rejected lower today after a results announcement.
The 200 EMA is sloping down and price is below the 200 EMA.
All in all #bearish
