#bitcoin - Back to Breakout-Level "H4"Bitcoin has recovered back to the Adam and Eve´s breakout-level. We have two clearly defined ways to be double prepared for what´s going to happen next. Currently, be patient. Even if you will miss 1-2% either direction, it´s more important to catch what´s happening in between rather than losing money whilst being stopped out several times due to pre-mature position-taking. Action ahead.
-------------------------------------------------------
Warm regards,
Neru
Neckline

#bitcoin - Adam and Eve hitting P-M and Neckline-Area "H6"On the 6-hour interval, Bitcoin has hit the first possible reversal price and hit the Monthly Pivot overnight. With a medium-target of around $12200, Bitcoin has support delivered by the Weekly R1-Pivot around $10400 and the former breakout level around $10100. Decisions are made here. Be smart and have the bullish and the bearish opportunities ready to trade. The general target of this beautiful reversal-bottom-pattern is around $13k, which would hit back the former high and the Yearly R1-Pivot. Once the Monthly Pivot is surpassed, there is likely bullish volume starting to come in, which would be great for this pattern.
Don´t underestimate this sort of chart formation, it formed our bottom at $3.1k and sent us into a parabolic bull-run. This would be the first high-interval Adam-and-Eve failing since I am in Crypto and watching BTC closely and I would consider a fail as extremely bearish.
______________________________________________________________________
Warm regards,
Neru

#bitcoin - A&E-Neckline within reach for the next two days.After we have seen a steady rise, the neckline comes into eye-sight, which will roughly be resistance between $10750 and $10900. At that point will be decided if we are bearish or if we are bullish. Not much more to say today. Marked the important levels as usual.
_________________________________
Warm regards,
Neru

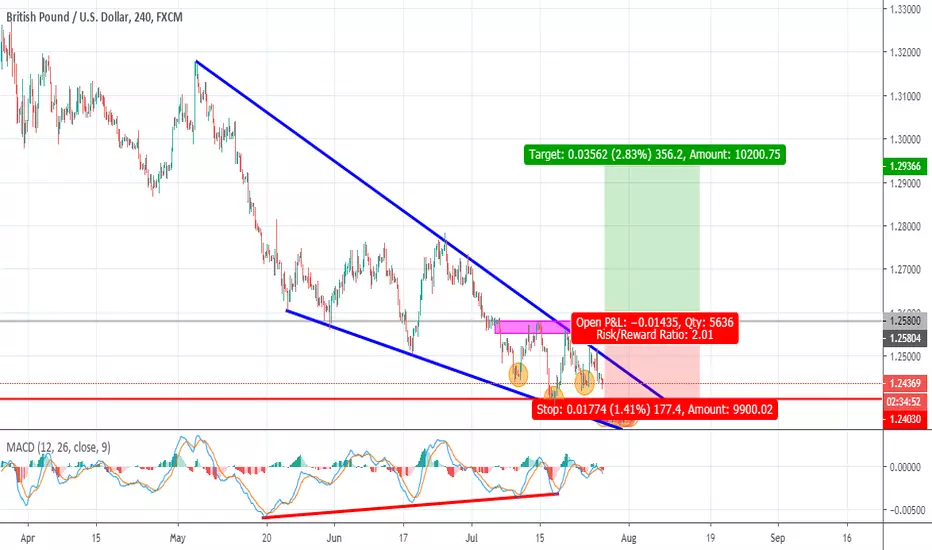
GBPUSD Long/Buy IdeaGBPUSD Long/Buy Idea
waiting for a momentum candle close above 1.2580 to buy this one
Reason:
1- Regular Bullish Divergence on MACD (in red)
2- Wedge Pattern (in blue)
3- Rejection/Support zone from Daily
4- Head and Shoulders pattern (in orange)
Three/Four confluences are enough to consider Buying GBPUSD, after a break above 1.2580 (in gray)
EUR/GBP 4H HEAD AND SHOULDER UPDATE!!Price Action (Technical Analysis): We have a very strong, healthy, respective Head and Shoulder Pattern here in the 4H time frame. Our neckline is 0.89553, our idea and discipline for entry would have been entering in the right shoulder when anticipating this pattern. (Right shoulder closing at the 38% retracement complimented by loss of bullish momentum) or Entering the market after we have our first impulse breaking pass our neckline giving us all the reason for price to correct itself to previous structure then waiting for a bearish price action reversal pattern. Both ideas are great ways to enter a Head and Shoulder Pattern obviously choice #2 being more confirmed then our #1 option.
Fundamental Analysis: None.

EURCAD Long/Buy Idea EURCAD Long/Buy Idea
waiting for a momentum candle close above 1.4730 to buy this one
Reason:
1- Head and Shoulders pattern (in orange)
2- Trendline (in red)
3- Trendline Rejection/Support zone from Daily
Three confluences are enough to consider Buying EURCAD, after a break above 1.4730 (in black)

A Weaker EURO Could Send FIBER Towards 1.09000 Level !Have a look at the main weekly TF chart which shows the price of EURUSD confined in a long term held and respected wedge ! The blue horizontal lines are the nearby support and resistance levels taken from the monthly TF . Several months ago this pair formed a bearish H & S pattern on the weekly chart which was broken as the price started to accelerate downwards partly due the FED being hawkish as they raised the Interest rates this making the USD more stronger against the basket of major currencies.
When the price broke the neckline of the pattern where also the main support now turned resistance was present (1.14500) , the price should technically HIT 1.09000 where the next concrete support is present. However many months have passed by the price is typically rangebound with 1.145000 level now turned into a concrete resistance.
At the moment most of the major central banks have started to ease their monetary policy, most notably the FED as a 25BP rate cut is already priced into the market which would likely take place at the end of this month. With the trade war effects already visible across the world it has certainly sent fears of an impending US recession as the yield curve stays inverted. Therefore the markets are largely expecting the FED to ease further in 2020 too.
So all this theoretically should make the EURUSD spike higher but practically there has been little impact from the BULLS. While other currencies such as the SAFE HAVEN pairs (USDCHF, USDJPY) have all taken the HIT and talk about GOLD which has broken multi year records. THEREFORE THE MAIN QUESTION REMAINS: WHY IS THE EURUSD SO RESISTANT AND STRUGGLING TO CLIMB FURTHER BEYOND THE PSYCHOLOGICAL LEVEL OF 1.15?
The answer to this question is not so complicated but the consequences are certainly bad for the EURUSD! First of all USD is still the world's reserve currency and the demand for it wont fade that easily. To add to this for many, the USD is a SAFEHAVEN compared to the EUR. Furthermore, if the FED eases their monetary policy their interest rate differentials will still be higher compared to the EUR which inturn would make the demand for the greenback stronger. Thirdly, the EUROZONE economy is not doing so well for the past months as most of the fundamental data as below the expectations
As the ECB president mario draghi term comes to an end, the new to be appointed former president of the IMF could change the course of this pair in the coming year. But as for now i feel this pair would likely HIT 1.0900 which is a concrete support and after that it might rise further depending on the economic and monetary outlook in the EUROZONE and The U.S.

INVERSE HEAD AND SHOULDER DXYThe inverse head and shoulder in the dxy might reach the neck line and continue up


Whales playing pingpong between bullish & bearish h&s necklineswe are now going on 4-5 consecutive neckline fakeouts here as bitcoin continues to walk the h&s neckline tightrope shaking the weakhanded longs and shorts alike. It could finally break and decide a direction this next move or it could continue to ping pong back and forth and grind sideways all month. Let's recall how during the bearmarket the priceaction went sideways in ping pong purgatory for quite sometime at 6k before finally continuing downward after the 3 day deathcross finally occurred. I anticipate that we will end up going sideways here much like we did there until this time we see our 3 day golden cross(not shown here) which is quickly approaching. this idea snapshot is of thee 4hr chart. If I can get a snapshot link of the 3day golden cross to show the image it will be posted below. Despite the recent correction's bearish price action it seems very likely the 3 day golden cross will still be happening in the near future. . .and much like the 3 day death cross broke price action out of the sideways ping pong at 6k during the bear market,,,the 3 day golden cross I anticipate will do the same here only allowing it to continue upward instead of downward. For now until I see price pick one definitive direction or the other...I hodl and make modest buys on dips that have a complete lack of volume confirmation.

AUD/CHF short setupI think the aud/chf pair breaks the neckline of double top pattern and pull back to the neckline and now I want to enter a short position.

Dblbottom neckline support vs. Logscale top trendline resistanceXRP gave us a tremendous breakout fakeout on the previous 1 day candle but closed above the neckline of the double bottom which is a very bullish sign...however we also closed under his pink descending trendline which is potentially the real top trendline of the descending triangle we've been in since back when the bear market got started. This trendline had been hiding on the log scale but could end up being the true most valid top trendline of the descending triangle pattern on the weekly chart. We can tell its pretty valid to some degree especially if it was able to both halt and reverse such a great looking breakout like yesterday's 1 day candle which its resistance found a way to flip from a breakout to a fakeout. They may have been satiated by the weak hands they shook though because even though price action was pushed back below the pink logscale descending top trendline, it still managed o close above the double bottom. So for now it is likely gonna be one of those heavyweight head to head battles between the support of the double bottom's neckline and the resistance of the logscale's pink trendline. As long as the current 1 day candle can find a way to close above the double bottom's neckline as well that should trigger a breakout and give us the proper momentum needed to finally break through the pink trendline's resistance. If it happens to be the true top trendline, the breakout target can take us to $1.75. The double bottom's breakout target is 59 cents so reaching 59 cents should sustain price action above the pink trendline long enough to trigger a breakout up from it as well. . .but I'm no financial advisor just throwing out opinions.

Bitcoin Cash doesn't seem to escape the Head & Shoulders patternI've been reporting for a few days a H&S pattern on Bitcoin and Rejections that have confirmed on a Bearish Trendline
Obviously, this is found on many altcoins and forks such as Bitcoin Cash
I take this opportunity to add a simple analysis of transaction volumes, here on Kraken chosen for its (alleged) absence of wash-trading, but similar on other exchanges: we have the bulk of the volume on the left shoulder and the head, with a steady decrease in volume for the right shoulder, typical of the Head & Shoulders patterns!
Now you have to confirm the breakout under the Neckline that I have drawn for you, and if that happens, the bearish target of about $ 260 is the height of the Head from the Neck line.
Good trades to all... under your sole responsibility, stop loss and risk management in support

Chart of the Day: $HYG under pressure$85.50 is the key neckline support for $HYG as it bounces off the top boundary of wedge pattern. The neckline can be seen with multiple previous SSR levels. The downward bias is reinforced by the current SSR level for which price action is firmly pinned under.
With an earnings recession in progress and oil demand in question, it is inevitable to see some stress emerging in the junk bond segment which has a fairly high representation of US shale players.

DENT is Finally About to go Bananas - Make 50% ROE!DENT is looking amazing - it just takes forever to form these patterns. But you can see how we have a bull flag to to take us up to the neck line and then hereafter we have an inverse HS Pattern.
D4
PS. Please give a LIKE for the good signal!

XAUUSD/GOLD short A head and shoulders pattern has formed on the 1hr charts and the resistance level has been respected. If looking to short wait for the neckline to be broken then enter at your own risk (Remember trade with confluence and manage risk properly)

USDCAD Long H4The Price bounces from Sensitive zone 0 ( now support ) and retested the neck line. also previously a head and shoulder pattern has made.

YELLOW METAL Might Break The Neckline Of H&S Amid RISK ON MarketMarkets are in the RISK ON mood which usually puts pressure on safe assets and currencies including the yellow metal. Here we see a HEAD AND SHOULDER pattern on the verge of completion!
The neckline will likely be broken soon enough as the risk ON markets dominates the appetite of the investors. Once the neckline gets broken we should see the selling pressure building up towards the next ascending trendline support that lies in the region of 1260.00 level.
I am already short on this pair with my entry being at 1295.000 level , TP at 1267 & SL at 1321.00
My trade that is short has been active since one month and once the neckline breaks we can expect the TP levels to be reaching soon enough.
This is just an outlook behind the current yellow metal state and where its heading, if you want to enter i suggest you do that at your own risk as the price has drifted away from our entry level and the RISK TO REWARD RATIO will NOT be 1:1 in this case. Nonetheless its a very high probability setup both technically and fundamentally. If you like my analysis please drop me a LIKE and FOLLOW me if you would like to receive more future analysis. cheers and thanks

Pin candle on neckline supportThis is the retest I was waiting for: a few days ago I posted an idea on #T highlighting a broken head and shoulders pattern. Today's candle loos like the perfect retest of the old resistance as new support.
Today's pin candle shows buyers' pressure around $31.50 and this seems a perfect area to go long; as always, evaluate this trade based on your risk aversion and money management.

EURUSD Buy - Awaiting Pullback to NecklineAfter the dollar has climbed for the past 3 weeks, the price has started to drop from a high since the beginning of this trading week.
EURUSD has managed to close above a 1-week range yesterday and that signals for the price to climb further with the dollar starting to drop.
Therefore, we can look for intraday buying opportunity should the price pulls back, which in this case, the neckline around 1.1240.

AUDCHF SELL!!!!! HEAD AND SHOLDERS FORMED
DOUBLE TOP FORMED
MARKET CURRENTLY AT NECKLINE OF HEAD AND SHOULDERS
WAIT FOR A BREAK BEFORE TAKING THIS TRADE

YELLOW METAL Looking TO Complete H & S Pattern On DAILY Chart!
The above snapshot represents the daily chart of the yellow metal. it can be clearly seen that the head and shoulder formation might just be about to completed soon!
The main chart (4hr) shows the channel has been breached with EMA 50 adding further confluence to downward move which could target the potential neckline of the overall H & S formation.
Once the overall pattern is complete, its safe to say that this pair can potentially drop towards to 1267.000 level where the long term weekly ascending trendline lies!.
Looking at the big picture, i am overall LONG on GOLD, however i would only enter LONG once the price hits the 1270.000 area so the better risk to reward ratio is by my side. At the moment i am short on this metal. If you would to take short this yellow metal based on your own comfort and analysis i suggest the following trade entries:
ENTRY LEVEL: CURRENT PRICE 1300.000-1307.000
STOP LOSS: 1330.000 (ABOVE THE RIGHT SHOULDER)
TAKE PROFIT: 1267-1270 LEVELS
PLEASE FOLLOW THE ATTACHED LINK IF YOU WOULD LIKE TO TAKE THIS TRADE. I WILL BE UPDATING ANY CHANGES IN THE LINK ABOVE. cheers

