AUD/USD - Inverse head and shoulders We can see that on the chart there is building up reversal pattern - Inverse Head and Shoulders. This is bullish reversal pattern and important is close above the neckline .
Wait for pullback (neckline), it should be good entry.
Targets: TP area (agressive)
0.382 Fibo (0.7076)
SL: Below the right shoulder -> 0.70260
Wait for entry! Wait for neckline breakout and pullback!
Neckline

USD/CAD - We need short retracementThis should be a short-term trade. I'm convinced the market has no more power to push the price up. We need to see a correction with a good potential.
After bad data from CAD GDP last week we saw nice bounce from the bottom of bullish trend channel and also move out from Falling Wedge (bullish sign). Now the market grow so fast so I guess there could be a little retrace. Why?
We can see market tested the previous swing High, the strong S/R area and we can expect retrace.
The next is building Rising Wedge (bearish pattern) in lower Time-frame.
RSI bearish divergence on lower Time-frame.
The good entry should be valid after breakdown of Rising Wedge or after retesting of this pattern. But if you want you can do agressive short with good SL (but without confirmation is high risk).
Where could market bounce upwards once again?
The strong support area n.1 which is strong and that should be our target. The Bigger one is support n.2, so the neckline (or trendline - blue), which market breakout upwards. We need to test it.
SHORT ZONE:
Now (not recommend - high risk) -> 1.337-1.336
Safer short -> after breakdown of Rising wedge or it's test
TP area:
Support zone n.1 (1.331-1.328)
Support zone n.2 (1.327-1.3255)
SL -> above red S/R area (1.3385)
This could be a good trade with nice RRR, but don't forget, you trade on your own risk and this is only my point of view not investing advice.

BUY GOLDGOLD
4H
BUY
REVERSAL ZONE (SUPPORT)
CONFIRM BY DOUBLE BOTTOM
PRICE PULLBACKED TO NECKLINE AND IT PRICE IS GOOD FOR INTER BUY POSTION
BUY AT:1327.50
SL:1319.80
TP:1339.30


BUY AUDUSD AUDUSD
4H
DOUBLE BOTTOM
CONFIRM BY CLOSE FIRST CANDLE STICK TOP OF NECKLINE
BUY ZONE AROUND: 0.7110---0.7120
TP: 0.7240
SL: 0.7049


NZDCAD Sell IdeaH1 - Head and shoulders pattern. Price did break and close below the neckline.
We may now look for more evidences of bearish pressure in order to start looking for sells.
The target for this sell setup would be the duplication from the head towards the neckline of the head and shoulders pattern.

bitcoin bullflag looking more like a symmetrical pennant now The breakout targets are still roughly pretty close to eachother even though price action on the flag is now looking more like a symmetrical pennant. I anticipate a break upward from the pennant no later than tomorrow but possibly tonight. That will put us above the neckline of the inverted head and shoulder pattern...I'm still not completely confident we will trigger the inverted head and shoulder breakout but plan on having a smart stop loss should a fakeout occur.

(Enter Jaws Theme) Buyers circling resistance in $BTCStill watching this neckline for a possible breakout. Buy dips and buy the breakout

Trend momentum starting to build for the bulls in $BTCThe neckline of an inverted head and shoulders is being examined as resistance, and all eyes will be on internal trend momentum to see if the price can breakout to the upside to continue wave 3 of the new motive wave to the upside.
The ADX measures the strength of trend momentum and the indicator is turning to the upside inside a trend strength building zone (above 20) as the green positive directional index inches higher to signal a bull trend... a good sign for the bulls.
This should make the psychological $4000 area support and the neckline should continue to be pressured this week with a likely upside break.
The RSI is validating this call with the oscillator staying inside the bullish zone, which supports the market.
$5200 is the minimum wave 3 call on a breakout ... all stops are placed underneath the 61.8% Fibonacci level around $3600.
Happy trading! buy dips!
Thoughts?

Inverted H&S Works Well With My Wave CountLooks like a start of a 3rd wave, which should bust the neckline of the inverted head and shoulders pattern to the upside.
Staying Long.. protective stops placed just below $3200.. will raise as price rises.
Thoughts?

EURUSD - My personal analysis28.12.2018 @ 4:22PM
Marked out where price may in the future move too.. I dont see price breaking the 1.14858 mark and making a new high. This train of thought is influenced by the fact that the economic outlook is rather bearish on the EURO but also the fact that we are touching a downward trend-line influenced on the weekly charts. There is clear resistance around the 1.12570 price point and allot of FIB level noise so one would lean more towards it will be very choppy until breaking the 1.12135 level. If this level is broken then we should probably wait for a retest before making any huge decisions. We all love a false break.. get in on the confirmation as this area is a key area on past price levels.. patience is the key.. and the price clusters.. reduce your risk by using them to your advantage!!
On the flip side the move higher is held down by the major trend 61.8% after breaking the level.. it point lines up with many extensions and will be a very hard level to crack.. I am not ruling out a bounce off this level as anything could and will happen.. but with the weekly trend, poor economics, poor outlook, neck-line on head and shoulders, stoch overbought and momentum and volume falling.. the likely hood of an uptrend vs downtrend at this particular time dosent seem to hold too much weight in the market.

BTC trying to (temporarily) reverse the trend. Will it succeed?All eyes are currently on the potential inverse H&S that might be forming its right shoulder on this pullback, and if completed it could take the price to around 5300-5400 area which is the projected target of the pattern.
As we've all noticed, when everyone expects something due to it being obvious on the chart, BTC tends to do the opposite, so don't put too much hope into this iH&S pattern.
It's just an idea for now, so we can have it on our radar.
The major trend is still down.
A break of 4400 is still the main condition for those higher prices mentioned above, and without it, none of these patterns matter much.
Nevertheless, we can't ignore (at least a temporary) reversal pattern forming for over a month now.
The longer the time period over which the pattern forms, the more reliable it is and the larger the move it makes once (and if) completed.
The key areas for this scenario are marked on the chart above.
3470-3400 zone must hold, otherwise, we are likely to see 3100s retested or even new lows.
If we see a good reaction (ideally) from around 3560, that would be a first positive step towards the iH&S pattern completion.
Note that 3650 was/is the minimum retracement necessary for this to play out.
I see two ways to trade this:
1. Enter with a speculative position size in the "ideal entry zone" marked on the chart with a stop loss below 3400.
2. (safer, more conservative way) Wait for the price to breakout and close a candle above 4400 pivot point, then buy the breakout or the pullback of that move. This way you get less profits but a lot more reliability in your trade.
It all depends on your trading style and risk apetite.
Either way, stop loss and risk management is crucial here, due to the main trend still being down.
You don't want to get caught in a long position if the main trend continues to the downside.
Note that this is a 12h timeframe chart, so it may take days to play out.

Bitcoin Doesn't Have the Strength to ContinueBitcoin looks to break this neckline and drop back into the low 3000s

BTC - inverted H&S including Bulldiv & VolumeThis is building setup is true trader´s dream, not only the Volume is a match, we have bulldivs on daily and 3-day, also the confidence BTC gained from the last
break-out of an inverted H&S within the full year of consolidation are signs AGAINST this being a Bulltrap. This is so crazy obvious, I wonder if that will be the reason for a total
fail of this Beauty. Merry Christmas!

Classic TEXT Book Head and shoulders Pattern LONG USDCHFThis is a classic head and shoulders pattern that may be signaling a long term buy on the USDCHF pair. The key is to be patient and pick a good entry for the long side of the trade. Remember, Risk management and Money management are the two thing that make or break any trader, no matter the system you trade.

XRP breaks well above inv h&s neckline forms higher highYou can see here on the 1 day chart that price has broken well above the neckline but is seeing resistance right at this blue horizontal line...what you cant see here is that the candle has already thrown a tiny wick above that line thus forming a higher high over the green candle where the horizontal line starts...in doing so XRP has broken the inside bar consolidation of that candlestick and now has a very high probability of going higher than that line and thus triggering and confirming the breakout from the head and shoulders pattern...We have also reached the small symmetrical triangle hidden in the right shoulders breakout target like I said we would do in the last video. So probability highly favors we trigger this head and shoulder pattern if so the target will be close to the black box near the top of the chart. Thanks for reading *not financial advice**

Head and Shoulders forming on EUR/USD (D)A possible H&S has been forming on the EUR/USD chart since mid-July 2017, visible through the daily chart.
The pattern has already threaten to break through in August 2018, but instead, happen to be only an extension of his 9 months old head.
Back in September 2018, it attempted to break through to the other side, trying to outperform the top of its right shoulder, invalidating the pattern and giving success to a possible bull run. Instead, it gave us a nice bull trap.
Such movement ended up not happening and instead, the price decided to come lower again, retesting the 1,13 area and possibly the H&S neckline, once more.
If the price is to break out the neckline, accompanied with some decent volume, this H&S pattern might be validated and some serious down prices are to be expected.
In accordance with that line of thought and through what I currently see in this chart, I present you with three possible targets, shall the price fail to hold on the neckline, and move further down.
A conservative target located at the 1,08 area (38,2%), a medium target at 1,05 (61,8%) and a more aggressive target at 1,03 (78,6%).
Shall the price rebound and move pass the 1,18 area, breaking it with some decent volume, this pattern should become invalidated.
Please, share your thoughts and ideas about what you think, how to trade it and how would you do it. Good trades everyone!

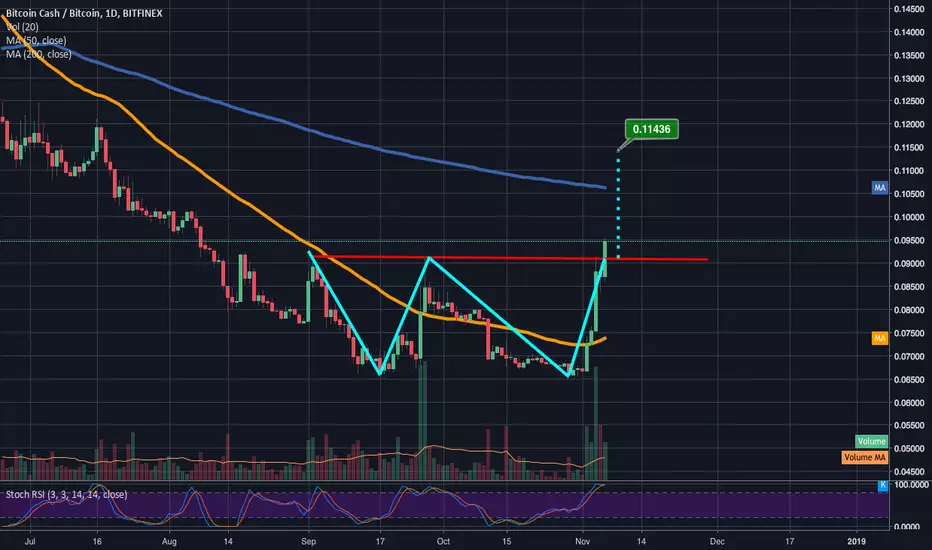
BCCash's double bottom has triggered!As I had predicted in my previous bit coin cash idea on here we reached the neckline of the double bottom on BCash and have finally triggered the breakout...the price target I have listed here is a great palce to limit sell, although we may run into decent resistance at the 1 day 200ma(in blue). We may also start to wick down just before this target too so a pip ro 2 below it as a limit sell isnt a bad call either...of course there's also a chance that fomo could allow us to send a bull wick a couple pips above this target as well. Whether or not your limit sell triggers as long as you got into this trade near the neckline a market sell will still get you plenty profit. *not financial advice*
GOLD has broken the necklineGOLD has broken the neckline
wait for pullback to short at structure 1235.55
or either short harami trade if inside bar fall below 1231.57
SL : 1240.20
TP : 1221

USD/JPY Short SetupThis pair has entered the consolidation zone once again after failing to match the previous high. The head and shoulders pattern is 95% complete as price is looking to retest the neckline once again and a break of this would be further confirmation that USD/JPY would melt taking out the monthly support and beyond. On the daily timeframe the recent bullish move stalled around the 38.2 fibonacci level, which illustrates that this bear market trend is strong and will continue now that this retracement seems to be over. The only obstacle on the way is the monthly support of 112.02, which one taken out, we can expect to see price to go lower towards 111.00.

Big Short for EURUSD?An almost complete head and shoulders pattern is observed in weekly timeframe for EURUSD with descending necline trend is about to be approached. It would be interesting to see how market reacts on this level in the coming weeks, but I have SHORT bias on this pair.
I believe aggressive trader can enter short trade the moment the price closes below the neckline and add on to their position when it retraces the neckline.
Conservative trader would want to wait until the first retracement to neckline before entering short trade.
Stay safe trader!
