America flooding the market with OILPlease like and subscribe if you want more analysis from me... I will appreciate that.
What's the point for OPEC to cut oil supply if America flooding the market with it?? The only one question, for now, is whether oil rally will end at the end of December or at the beginning of first quarter of the year 2018?
Read this Article: www.bloomberg.com
Neckline

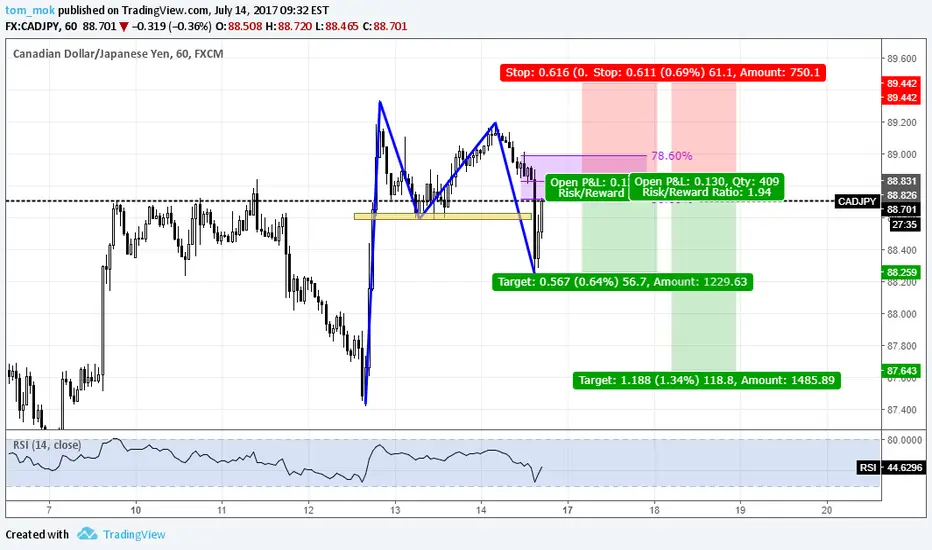
NZDUSD - LONGAlthough, NZDUSD is in a downtrend, the price met a pretty strong support @ 0.6840 from which it seems to react.
I will try a long trade from the neckline of the previous structure till 0.6950, possibly 0.70

EURUSD Continuation pattern under the necklineEURUSD Friday Update
Although now flat on all pairs escept USDJPY, still believe EUR is going to weaken, just not convinced
there's enough impetus right now to force it back lower into new lows with any real power behind it.
It's either going to fail here, as it's back testing the neckline of the head and shoulders looming
above it - high in London at 1.1671, so if you're still short from 1.1648-1.1665 with stop
15 points higher at 1.1680 it hasn't been hit yet and it probably will come off from here
so it's Ok to short with same stops as above, at 1.1680 but only for 40 pips or so back to
1.1613 - then look to close out as it will likely rally again from around here (Unless you catch this short from the
neckline at 1.1665 risk reward ratios are not worth chasing for these few pips - 2 to 1 shots are hardly
worth the risk, imo, but you may be OK with that)
...we then need to see it trade 15 pips lower, to 1.1598 to trigger a new short, looking to get in on the next minor
pull-back for a move down to 1.1482 initially.
The other point where we can expect a reversal for EUR, if not from here, will be off the upper
parallel and will require the following price action to become reality: Eur will have to break above
the neckline at 1.1665, then bust the stop 15 pips higher. Time, then to switch into longs for
a move up to the parallel where will look to go short once more.
So far price action on this pair all week has been a continuation pattern under the
neck-line, suggesting further weakness for EUR soon - but annoyingly the pattern can play
out a while longer and this period of range trading within the range set out for the week so
far could well persist for a day or two more - OK for day traders but no help for swingers...
for them we need to see a break out of this week's range, as outlined above.
Too long writing this...in the time it's taken EUR has already fallen 16 pips...too much waffle! But am out this afternoon Uk time so have tried to cover every eventuality I can see - too much information though. Will try to paraphrase in future


USOIL-H4 short term and long term targetsLets combine Elliot Wave and technival analysis. According to D1 chart price is bouncing from a long term S/R and neckline (triple top):
We see also a previous WXY structure already completed.
Here on H4 chart:
- 0.61 fib retracement
- first convergence
- trendline (channel) broken and retested
- H1 expanded flat
Thats all, entry point and targets are shown on chart.
Best regards

AUD/CAD Head and ShouldersAUD/CAD Recently rejected huge resistance/trendline levels. Currently in a Head and Shoulders pattern. Only when neckline is broken is a good time to short. If market structure changes then the idea is void. Trade safe traders.

Eur Sgd SHS keep ya eyes open for a neckline break of that SHS pattern..if we see a nice break n close there is no reason why you shouldnt enter short


usd cad possible double top!?possible double top at usd cad ... we need to break the neck and the trendline before a short will be executed...a bounce and continuation upside also possible so lets react to price movment not predicting it ;-)


GBPJPY Head and Shoulders pattern froming at Monthly levelH&S forming at monthly level adds to the downside move.
Break of the neckline is a short signal for me.

EURUSD in nice head and shoulder patternCurrently, EURUSD is in a shoulder-head shoulder pattern. If this formation is confirmed and the neckline breaks, the first profit target is at 1.1700. If you trade this pattern by mirroring the height at the neckline, the target is even 1.1500.


USD/PLD 4HR Head and Shoulders Pattern Head and shoulder pattern emerging on the 4 HR chart for USD/PLD. The pair moved back up to the neckline and waiting to bounce or break through resistance. Follows, Comments, and Likes are appreciated!

Bullish Head & Shoulder Formation on $EURAUDHey guys,
went long on EURAUD H&S formation @1.4658 this morning.We recently hold an important strc. level and the 200 EMA.
Remember to trade your plan!

Nzd Chf shorta potential short here with shs right at resistance with rsi divergence in play
after break of trendline i will open half position and add another half after support/neckline break
stay patient

NZD/JPY - POSSIBLE SHORT ENTRYFX:NZDJPY
The rate has climbed up and is now testing the two-and-a-half-year falling trendline resistance. The current level is also the former broken neckline of a completed head and shoulders pattern back from February.
I will be looking for selling opportunities on shorter time frames, however the stops should be based above the resistance area (81.00) and possible target - the major support level around 76.00.
- See more at: www.tradeitsimple.com

POTENTIAL HEAD AND SHOULDERS ON EUR/USDFX:EURUSD
The rate has formed something of a head and shoulders pattern on the 4H chart at the long term massive triangle resistance.
I am looking for break of the two-and-a-half long rising trendline and the pattern's neckline below 1.1160 to enter new short positions.
Such a break should trigger a drop to short term target at 1.1000 with a potential move towards the medium term target around 1.0800.
A weekly close above the June highs above 1.1300 is needed to invalidate my bearish bias on the pair.


AUD-CADdouble bottom is loading ...
after the breaking of the neckline >>> price will reach to the curve ...
