USDCAD 4h Double Top FormationOn the USDCAD pair, we've had a decent up movement on the daily chart for about 580 pips. Now a double top has formed with the second top being lower than the second one. Essentially, this is a textbook double top formation. Price is now at what one would call the neckline, and if broken, I am placing a sell order at 1.3375 with a target of 1.3325 and a stop loss at 1.3425.
1:1 risk/reward ration
Neckline

NZDCAD Daily Triple Top w/ Slanted Neckline3 times price on this pair retested the resistance zone surrounding 0.96 seen above. The first time price reacted bearishly (the first top), however it did not go far down as it did previously (see 2015-12-29 date on chart). The second time price broke above the zone but then fell some - forming a second top and then going down to make a higher low. Then again, the third time it formed ANOTHER higher high and is currently going down from that.
The fact that there has not been a lower high followed by a lower low suggests that this pair is technically still up trending. This is key, however, because that means that we can get a position in on time.
The white support trendline is in fact the formation neckline. Price will definitely head to the TL next week, and then maybe to the 0.9290 area. We must wait for a lower low and then for a lower high to short this pair, or at least I am, you do what you like.

NZD/USD approaching support Currently have this pair on my watchlist for the upcoming week. Should price continue to move downward breaking the 200 EMA, I'll enter short beetween 0.70500 and 0.69600, coincident with the head and shoulders neckline, on a doji/pin bar candlestick. I will then consider to take profit / scale out around 0.6700 in case the upward-sloping trendline will provide strong support
Hope you liked the idea, wish you good luck!

AUDNZD Head & Shoulders Idea Still HoldingJust as I predicted earlier last week, AUDNZD went down to the 1.04 area to complete the second shoulder of this inverted formation. Now it will likely be heading up to the 1.07 area to the neckline resistance, and hopefully, even more past that.
I suppose a buy order would work when markets open, with a target just below 1.07, so like 1.0685.
Overall, I am bullish on this pair.

EURCAD SHORT OPPORTUNITY AFTER PASSING NECKLINE & RETESTEURCAD SHORT OPPORTUNITY AFTER PASSING NECKLINE & RETEST


AUDUSD -2 scenarios2 possible scenarios
1-breaks the neckline and continue up
2-bounce from resistance and goes down
my best guess is 1.

xag usd looking for short silver after break through the trendline and neckline of this little head and shoulders

USDCAD - Neckline ResistanceIt's a quite good R/R on this Neckline resistancet in my opinion while the Risk is not that much but the Reward quite okay and possible.
The Volume Profile suggests the Resistance is good defended.
Not that great with words, so i make an update to form my thoughts on this properly.

GBPAUD At neckline -> buyPrice is around the neck line level (H&S).
I'm kooking to get into a buy trade once it breaks the trend resistance as well

Gold falling? Contrarian outlookUse the crosses of the moving averages (7, 13, 26, 52) as the beginning of the uptrend. Broken neck line and now consolidation on the H4. Still a good buy if the dollar continues to waver (long term)

USDCAD: Key Levels to Watch for Potential EntryMornin' traders! There are a couple of key levels to watch here on USDCAD. The most important of which to me is the 1.284 area. Before taking a long position I want to see price close the weekend gap and touch the unhit daily pivot for Friday. Since a higher low was created from a bullish impulse, I will be looking for bullish price action (pinbars, engulfing candles, signs of rejection) at this level toward the neckline and possibly further if the H&S pattern remains valid. Until then, I'll be by the sidelines watching. Happy Trading!

eurgbp here is a re entry trade for eur gbp ..
new supply zone ...check
falling trendline... check
kind of dirty shs waiting for neckline retest ....check
i expect a nice short trade ..

AUDUSD ANALYSIS WEEK OF JULY 31, 2016Weekly:
Price is at major resistance area at 0.76000. The candle did not close bullish above last weeks candle followed by the bearish shooting star. Finding a nice short would be a good idea before its continuation up.
4 Hour:
Price is in a nice upward channel. I see a possible Head & Shoulders pattern forming. The right shoulder can possibly form in the price area of 0.76000 - 0.76500. Break of the neckline is a good area to enter for short. Next area to look at to long would be 0.72500 - 0.72800
Wishing everyone a good trading week!

HEAD and shoulder found, short EURUSDLike, Comment and support.
After earning 450+ pips from my last EURUSD idea, Short EURUSD again as I found head and shoulder pattern and neckline also seems to be broken so better to go short after watching price action

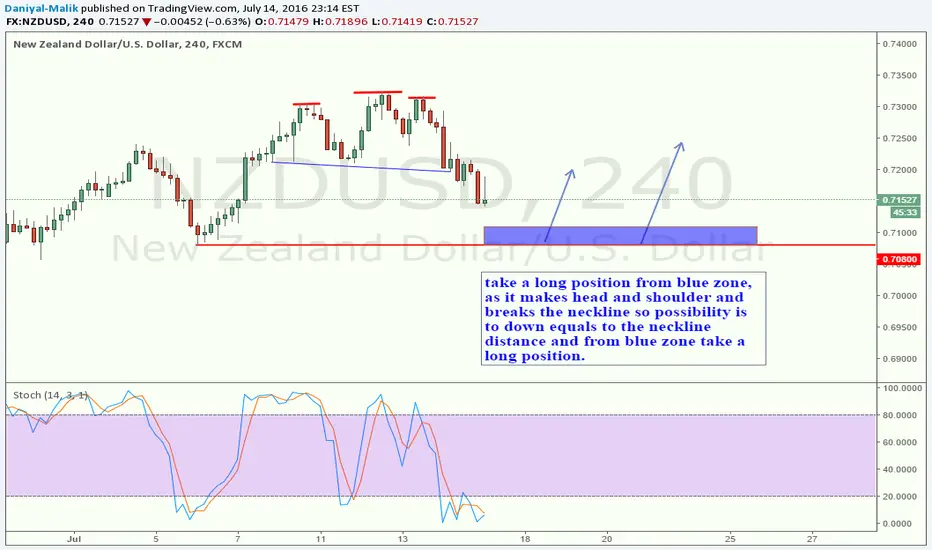
take a long position from blue zone, take a long position from blue zone, as it makes head and shoulder and breaks the neckline so possibility is to down equals to the neckline distance and from blue zone take a long position. as there is a support over there

AUD/USD / Shoulder, Head, Shoulder Pattern + Doji candleAUD/USD , Daily Chart. RSI (9,close), EMA (21, RSI).
Risk Reward Ratio: 4.83.
Shoulder, Head, Shoulder Pattern + Doji candle.
If price break the neckline can continue a strong bearish progression.
Doji candle confirm the pattern.

PNB : Head n Shoulders PatternUsually I don't trade head n shoulders unless there are other valid reasons to enter.
If you are an aggressive trade, you might want to enter just after the breakout of Neckline which has happened on Friday market closing.
If prices are at your expected entry level during Monday open you can go short in PNB
Happy Trading !

GBP/JPY - possible break out?One to watch of the next couple of days to see if this comes into play...
- Textbook head and shoulders formation, lets see if this one can break the neckline, if so trade the breakout.

Dow Jones forecast week commencing 16th MaySo on Friday 13th May, we have seen the classic head and shoulder topping pattern confirm here on a lot of major indices. You could apply this thinking also to S&P500 and its derivatives Spy etc.
So the head and shoulder neckline break, all in shorts right? Wrong. Note the orderly bearish action, respecting fibs very tightly on the way down. Also note the formation of a downward channel in the process of forming the head and right shoulder. Also note that next week is options expiry (Opex) on Friday 20th May. This chart tells you all you need to know about what usually happens in these weeks northmantrader.files.wordpress.com
So my plan for next week is perhaps initially scalp short, and look for a reversal around the bottom purple channel line. If this plays out well and we see reversal there, you can get long and hold it, perhaps even past opex into week commencing 23rd May. Just keep bringing up your stops to lock in profit, or ride the trend (buy dips) intraday if you prefer.
If all goes according to plan (warning - it usually doesn't :D), we'll hit the upper trendline, and this will coincide with a 61.8 retracement and also a proper retest of the H&S neckline as resistance. If the plan is still in tact at this stage, that could be an excellent place to look for shorts, aiming for the technical target of the H&S, all the way down at 17k on the dow (which also coincides with the big 2000 level on S&P 500)


Reposting AAPL short in a clearer wayPeople will laugh at you if you say $75 as a price target for AAPL-3.06% . But there are some good technical reasons to believe it might happen, outlined in this chart.
WE have an unfilled gap at $75, and a confirmed H&S top with a technical target that takes us to the gap.
Sentiment has turned and while a move to $75 would be extreme for such a profitable company, extreme things happen in the market more often than we like to think.
Even if you don't like the short, if AAPL-3.06% does freefall, the $75 mark represents an excellent target from which to buy and hold as an investor, if you believe the company is extremely undervalued at such a level.
Update status
