USDCAD - HEAD AND SHOULDERS 📉
The USDCAD price is in Bearish Head And Shoulders🧐
The neckline is broken & retested🔥 the resistance line of the ascending channel is broken 🔥
so, i predict a bearish move 📉
TARGET: 1.32088🎯
...
if you agreed with this IDEA, please leave a LIKE, FOLLOW or COMMENT!
Neckline

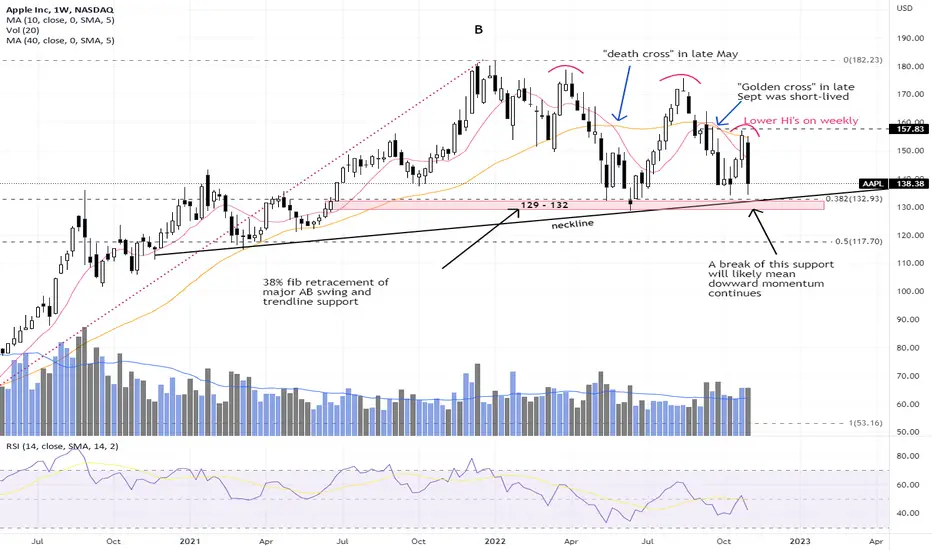
AAPL - looking vulnerableAAPL had been the strongest among the FAANG (aka MAMAA) stocks. In the past week we saw AMZN, GOOG, META breaking lower, a sign that the Nasdaq isn't on it's way to sustainable recovery anytime soon.
While AAPL appeared more resilient, it's weekly chart had been forming lower highs since the start of this year and is now back to testng a critical neckline and horizontal support zone between 129-132.
Should AAPL start to break below this "neckline", then expect more pain / volatlity in Nasdaq for a while. Cautious on AAPL at the moment unless it can trade above it's 50day moving average again for a start (preferably a golden cross too).
Disclaimer: Just my 2 cents and not a trade advice. Kindly do your own due diligence and trade according to your own risk tolerance and don't forget that money management is important! Take care and Good Luck!
GBPCAD I Potential Buy from Support NecklineWelcome back! Let me know your thoughts in the comments!
**GBPCAD - Listen to video!
We recommend that you keep this pair on your watchlist and enter when the entry criteria of your strategy is met.
Please support this idea with a LIKE and COMMENT if you find it useful and Click "Follow" on our profile if you'd like these trade ideas delivered straight to your email in the future.
Thanks for your continued support!
Brian & Kenya Horton, BK Forex Academy

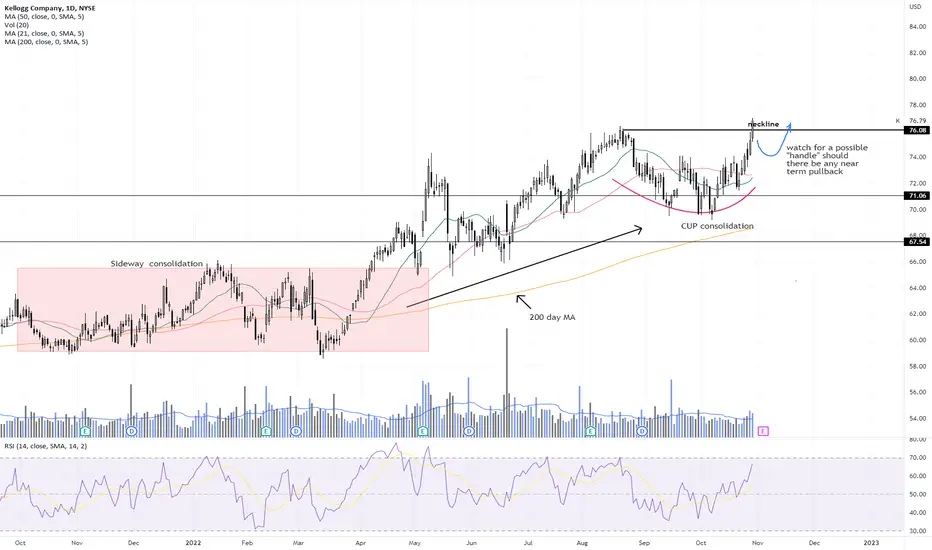
K - Cup break upK is a long term investor's dream as the stock continues to be in an bigger uptrend (despite that it has it's fair share of volatility).
For the past 2 months, the stock has gone into a cup consolidation and finally broke up last Friday, probably in anticipation of earnngs that is expected out on 3 Nov (BMO).
We do not know if this breakup is for real but should there be any near term pullback below the neckline, then I would be watching for a possible "handle" (higher low) which could make the case for a solid cup and handle formation,
Disclaimer: Just my 2 cents and not a trade advice. Kindly do your own due diligence and trade according to your own risk tolerance and don't forget that money management is important! Take care and Good Luck!
CDAY - will earnings be the catalyst?CDAY has formed an inverse H&S and is now trading close to it's 200 day moving average. However, the stock might not be on a sustainable uptrend just yet until it can clear the neckline around 70.80.
With earnings expected on 2nd Nov (AMC), let's see if it could propel the stock above the neckline. When it does, it is still prudent to place an initial stop loss (say) just 5% below the neckline (to avoid sharp drawdowns). It is always better to keep losses small and re-enter when technicals look right again.
Disclaimer: Just my 2 cents and not a trade advice. Kindly do your own due diligence and trade according to your own risk tolerance and don't forget that money management is important! Take care and Good Luck!

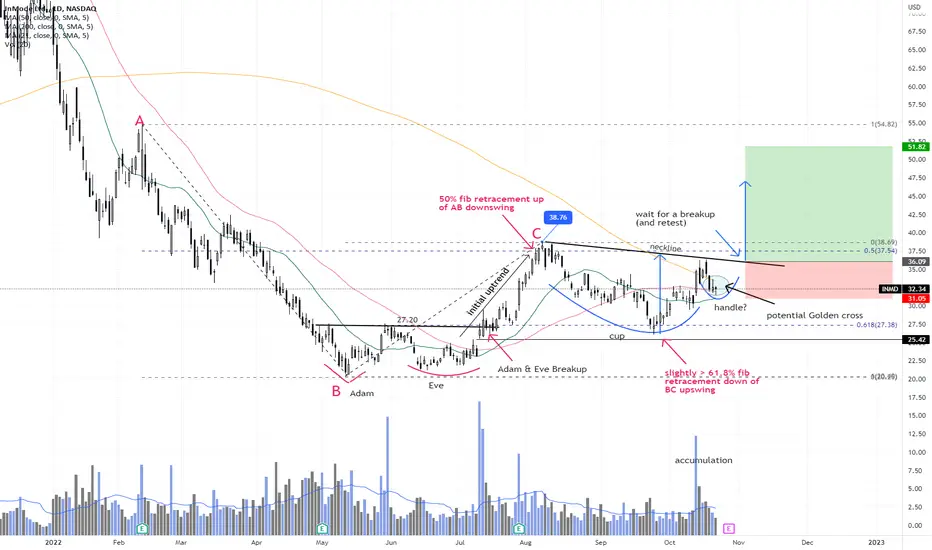
INMD - potential Cup & HandleINMD seem to be a great study on chart patterns and fibonacci retracements! :)
The stock first broke out from an Adam & Eve neckline @ 27.20 on 13 July, propelled 42% from here to a high of $38.76 (which was a 50% retracement up of the intermediate downswing AB).
It then lost momentum and started a steep pull back, finding support only around 61.8% fib retracement of the recent upswing AB. This steep retracement and subsequent action is beginning to shape into a potential Cup & Handle pattern (a pattern which is a lengthy "pause/consolidation" in a prior uptrend).
With earnings round the corner (expected on 3 Nov), will it be the catalyst that propel the stock to successfully break up from this C&H formation? If and when it does, we will have a golden cross (20day MA crossing above 50day MA) as well.
Nothing is guaranteed so we can only wait and see! LOL. Earnings can swing both ways although the strong volume accumulation on 13 Oct seem to suggest expectations are to the upside.
If and when the stock breaks up, then it further consolidates the stock's recovery is well underway (even if it might still be volatile). Long @ breakup or at first initial pullback towards C&H neckline Initial stop loss with be at most recent pivot low (C&H's "handle's" low)
Disclaimer: Just my 2 cents and not a trade advice. Kindly do your own due diligence and trade according to your own risk tolerance and don't forget that money management is important! Take care and Good Luck!
SAM - Time to bottoms up?After having fallen a whopping nearly 79% from it's peak in April 2021, SAM appears to be finally turning the corner, after forming a rounded base in the past 7-8 months.
It hit rock bottom on 16 June, right where it was a former low during Covid crisis (March 2020). A month later, there was a strong spike in volume due to earnings beat (by 1.11%, not too fantastic, but still a beat nevertheless). The stock then pretty much went nowhere until last Friday, after it reported a much stronger earnings beat this time.
What is significant this time is that it managed to gap up and close above the base formation neckline @ 396, a 19.7% rise within a day. Weekly RSI is strong and rising.
However there is a near term resistance at 407 and we could see some consolidation around there. Buy the dips is probably a good idea.
Disclaimer: Just my 2 cents and not a trade advice. Kindly do your own due diligence and trade according to your own risk tolerance and don't forget that money management is important! Take care and Good Luck!

TOST - potential golden cross & inverse H&SDespite the volatility, TOST is still showing superior relative strength to the market, now trading 66% above it's June's low of $12.
A golden cross (50day MA crossing above it's 200day MA) might be happening soon, plus it is also trading close to the neckline of now a more apparent inverse Head & Shoulders Base.
Perhaps these are signs that earnings (expected on 3 Nov) could surprise to the upside. Let's see!
p/s still a very volatile market. trade at own risk.
Disclaimer: Just my 2 cents and not a trade advice. Kindly do your own due diligence and trade according to your own risk tolerance and don't forget that money management is important! Take care and Good Luck!

EURCHF - Wait For The Trigger!Hello TradingView Family / Fellow Traders. This is Richard, as known as theSignalyst.
on DAILY: Left Chart
EURCHF is approaching a resistance zone in blue so we will be looking for sell setups.
Knowing that EURCHF can still trade higher inside the zone before going down.
That's why we don't sell blindly, we always zoom in to lower timeframes and wait for the bears to take over.
on M30: Right Chart
EURCHF is forming a double top pattern but it is not ready to go yet.
Trigger => waiting for a momentum candle close below the gray neckline to sell.
Meanwhile, until the sell is activated, EURCHF can still trade higher.
Which scenario do you think is more probable and why?
Always follow your trading plan regarding entry, risk management, and trade management.
Good luck!
All Strategies Are Good; If Managed Properly!
~Rich

AUDUSD - HEAD AND SHOULDERS 📉The AUDUSD price is in Bearish Head And Shoulders Pattern 🧐
the Neckline is broken ✔
so, i predict a bearish move 📉 im waiting for a pullback 📈
TARGET: 0.62051 🎯
...
if you agreed with this IDEA, please leave a LIKE, SUBSCRIBE or COMMENT!

CPNG - inverse H&SThe techs are lining up quite nicely for CPNG so far with all 3 moving averages (20,50 and 200) about to cross up in the right order. A break up above the neckline @ 21.35 (esp with solid volume) will be a good buy point. However, it is probably prudent to test with small amount first and add if it pulls back to retest near the neckline (or pyramiding up is ok if overall momentum is strong). I will put initial stop loss just slightly below $19 and trail stops up if trade is working out. Take partial profits if it is able to reach around 26.5 (resistance there). Let's see if it works out!
Disclaimer: Just my 2 cents and not a trade advice. Kindly do your own due diligence and trade according to your own risk tolerance and don't forget that money management is important! Take care and Good Luck!

USDCHF - RESISTANCE BECOMES SUPPORTthe USDCHF price breaks the daily Resistance level ,the old resistance becomes new support level ✔
the neckline of the double bottom is broken 🔥
so, i predict a bullish move 📈
TARGET: 1.00149🎯
if you agreed with this IDEA, please leave a LIKE, SUBSCRIBE or COMMENT!

$XBI possible inverted head and shoulders bottom$XBI biotech ETF developing
a possible inverted
head and shoulders bottom formation
neckline breakout 93.50

GBPAUD H1Hi traders, GBPAUD is setting up for a upside move the price is testing the support level and double bottom neckline.

USDJPY - BEARISH TRIPLE TOP 📉The USDJPY price is in Monthly Resistance Level and Bearish Triple Top Pattern 🧐
the Neckline is broken and Retested ✔
so, i predict a bearish move 📉
TARGET: 136.438 🎯
...
if you agreed with this IDEA, please leave a LIKE, SUBSCRIBE or COMMENT!

EURCHF H1Hi traders, EURCHF is setting up for a long watch trendline breakout and look for long GOOD LUCK.

AUDJPY It will go up from support Welcome back! Let me know your thoughts in the comments!
**AUDJPY - Listen to video!
We recommend that you keep this pair on your watchlist and enter when the entry criteria of your strategy is met.
Please support this idea with a LIKE and COMMENT if you find it useful and Click "Follow" on our profile if you'd like these trade ideas delivered straight to your email in the future.
Thanks for your continued support!
Brian & Kenya Horton, BK Forex Academy

TOST - uptrend underway TOST broke out of an Adam & Eve bottom formation on 10 Aug and has since been rather choppy, retesting the neckline support twice.
However, this stock is showing strength relative to the overall market, having already almost doubled from it's May's low @ 12.00.
It is in early days yet, expect some choppiness due to the overall market uncertainties but as long as each pullback is minor (not more than 50% fib retracement of each mini swing up, worst case 61.8% retracement), then it's ok to sit tight (but raise your stops up to just below each pivot).
Disclaimer: Just my 2 cents and not a trade advice. Kindly do your own due diligence and trade according to your own risk tolerance and don't forget that money management is important! Take care and Good Luck!

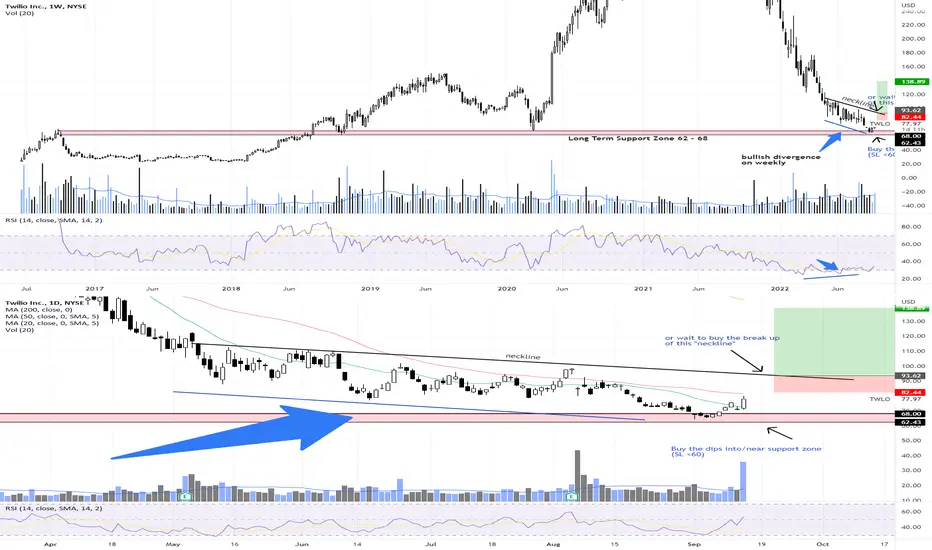
TWLO - Bottom could be in (don't shoot me if wrong)TWLO has established a strong support zone around 62 - 68 as can be seen on the weekly chart.
Weekly bullish divergence in it's RSI can be seen since June while the stock was meandering lower, eventually hitting into the long term support zone and we finally saw a good bounce off this zone on strong volume yesterday.
There is a good chance that this zone will continue to act as the support (though never say never!). Those buying near this support could place a stop loss slightly below this zone. However there is a chance the stock could be choppy for a while and we might not see real momentum until it can trade a fair bit higher.
Hence a more "conservative" trader would probably prefer to wait till it garners enough momentum to at least break above the near term neckline resistence before going long (by then we have the 20 MA firmly crossing above the 50MA).
Disclaimer: Just my 2 cents and not a trade advice. Kindly do your own due diligence and trade according to your own risk tolerance and don't forget that money management is important! Take care and Good Luck!
GBPUSD | New perspectiveThe Pound appears to have put an end to its three-week losing streak with an attempt to stage a strong comeback after breaking out of the structure during the latter part of last week's trading session. As we head into the new week, I want to be looking for buying opportunities above the key level at $1.15750.
Risk Disclaimer:
Margin trading in the foreign exchange market (including commodity trading, CFDs, stocks etc.) has a high risk and is not suitable for all investors. The content of this speculation (including all data) is organized and published by me for the sole purpose of education and assistance in making independent investment decisions. All information herein is for your reference only and I take no responsibility.
You are hereby advised to carefully consider your investment experience, financial situation, investment objective, risk tolerance level, and consult your independent financial adviser as to the suitability of your situation prior to making any investment.
I do not guarantee its accuracy and is not liable for any loss or damage which may result directly or indirectly from such content or the receipt of any instruction or notification therewith.
Past performance is not necessarily indicative of future results.

USDCAD H4Hi traders, USDCAD is setting up for a downside move watch price action and look for short GOOD LUCK.

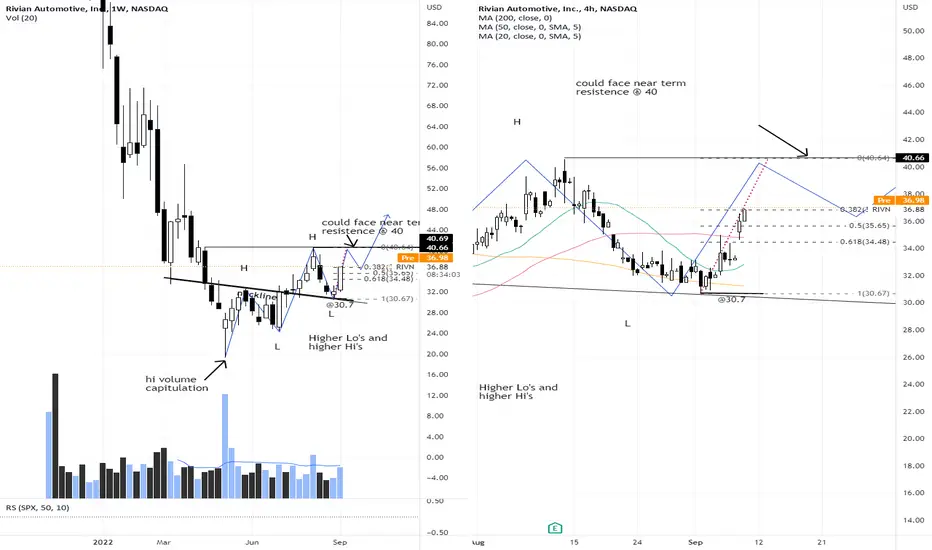
RIVN - Trending upRIVN had a high volume capitulation at the start of July and has since been forming higher low's and higher high's (apparent on weekly chart).
It has retraced to retest the neckline support on 1st Sep (@ 30.70) forming a new higher low. The up trend is now apparent and clearly there is room to go higher in the mid to longer term
Expect some resistance around 40-41, however it is unlikely to breach the recent low at 30.70.
One can use fibonnacci retracement find likely supports for any near term retracements. Retracements of no more than 50% of the upswing is preferred and a sign that the uptrend momentum is intact.
Disclaimer: Just my 2 cents and not a trade advice. Kindly do your own due diligence and trade according to your own risk tolerance and don't forget that money management is important! Take care and Good Luck!
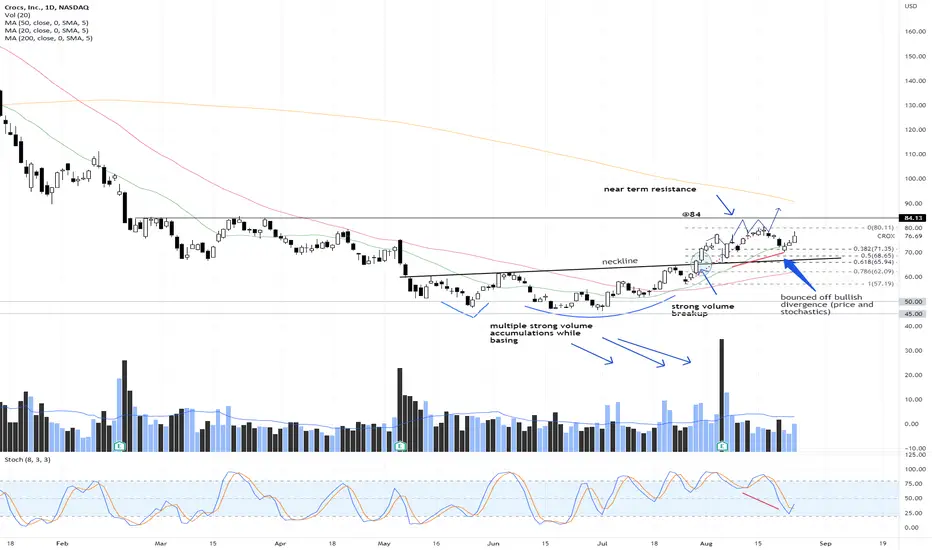
CROX - uptrend still intactDespite the sharp pullback last week, CROX did not break the near term support (adam & Eve neckline), and still forming higher highs and higher lows right now.
Stronger resistance coming up around $84 so watch out here.
Disclaimer: Just my 2 cents and not a trade advice. Kindly do your own due diligence and trade according to your own risk tolerance and don't forget that money management is important! Take care and Good Luck!