NEIROUSDT: Critical Support Zone – Rebound or Breakdown Ahead?🔍 Price Structure & Pattern Formation
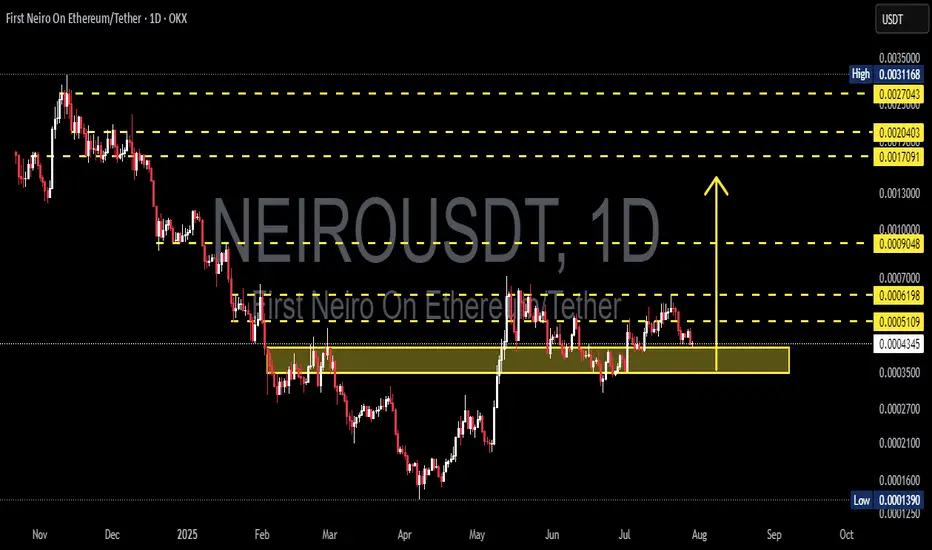
On the daily chart, NEIROUSDT is currently testing a major demand zone (highlighted in yellow) between 0.0004337 – 0.0003500 USDT. This area previously acted as a strong accumulation zone back in May and is now being retested as key support.
Price has entered a consolidation range after a short-term rally from April to May 2025.
Strong Support: 0.0004337 – 0.0003500
Nearest Resistance Levels: 0.0005109, 0.0006198
---
📈 Bullish Scenario
If the price holds above the demand zone and forms a valid bullish reversal pattern (e.g., bullish engulfing, pin bar), then a bullish move could follow.
Upside Targets (Resistance Levels):
1. 0.0005109
2. 0.0006198
3. 0.0009048
4. 0.0017091 (extended target)
5. 0.0020403
6. 0.0027043 (mid/long-term target)
Bullish Confirmation:
Daily close above 0.0006198
Increasing volume on bounce
Bullish candlestick formation in demand zone
---
📉 Bearish Scenario
If the price breaks below 0.0004337 and closes the day under it, it would indicate further downside potential.
Downside Targets (Support Levels):
1. 0.0003500 (bottom of demand zone)
2. 0.0002700
3. 0.0001600
4. 0.0001390 (previous major low)
Bearish Confirmation:
Strong daily close below 0.0004337
Retest of the zone fails as resistance
Bearish volume spikes
---
📐 Price Patterns
Potential Double Bottom: A bounce from this zone may form a double bottom pattern, with the neckline near 0.0006198.
Sideways Range / Accumulation: Price action since June indicates potential accumulation if the support holds.
---
🔑 Conclusion
NEIROUSDT is at a critical juncture — waiting for confirmation whether it will bounce from this strong demand zone or break down to continue the bearish trend. Key resistance and support levels are well-defined, providing clear strategies for breakout or rebound traders.
---
📌 Trading Suggestions
Aggressive Longs: Look for bullish signals inside the demand zone (0.00043 – 0.00035)
Conservative Longs: Wait for a breakout above 0.0006198 for trend reversal confirmation
Shorts: Enter if there's a confirmed breakdown below 0.0004337
#NEIROUSDT #CryptoAnalysis #TradingView #AltcoinWatch #SupportResistance #TechnicalAnalysis #BullishSetup #BearishScenario #CryptoTA #ChartUpdate #PriceAction
Neiroethusd
NEIROETH Breakout Loading!$NEIROETH is currently consolidating within a symmetrical triangle pattern on the daily chart, suggesting a potential breakout in either direction. The price action has respected this pattern for several weeks, gradually forming higher lows and lower highs. Notably, both the 100 EMA and 200 EMA are acting as dynamic support, reinforcing the bullish structure. A confirmed breakout above the upper trendline could open the door for a strong move toward the $0.21 level, offering significant upside potential.

NEIROETH ANALYSIS (12H)It appears that the NEIROETH diametric pattern started from the point where we placed the green arrow on the chart and completed at the point where we placed the red arrow.
Since the bullish pattern has ended and the price is below the descending trendline, sell/short opportunities can be considered in the supply zones.
The target could be the green zone.
Closing a daily candle above the invalidation level will invalidate this analysis.
For risk management, please don't forget stop loss and capital management
When we reach the first target, save some profit and then change the stop to entry
Comment if you have any questions
Thank You

NEIROETH Looks Bullish (4H)The correction of NEIROETH started from the point where we placed the red arrow on the chart.
This correction appears to be a diametric pattern, and we are currently in wave f.
Wave g could complete in the green zone, leading to the start of a bullish wave.
The closure of a daily candle below the invalidation level will invalidate this analysis.
For risk management, please don't forget stop loss and capital management
When we reach the first target, save some profit and then change the stop to entry
Comment if you have any questions
Thank You

#NEIRO/USDT#NEIRO
The price is moving in a descending channel on the 1-hour frame and is adhering to it well and is heading to break it upwards strongly and retest it
We have a bounce from the lower limit of the descending channel, this support is at a price of 0.00037460
We have a downtrend on the RSI indicator that is about to break and retest, which supports the rise
We have a trend to stabilize above the moving average 100
Entry price 0.00038150
First target 0.00039430
Second target 0.00040680
Third target 0.0004296

NEIROUSDT 1DNEIRO ~ 1D
#NEIRO This is a very important support block for this meme coin,.if you still have Conviction on this coin,. Buy in stages from here. with a short term target of at least 20%+

NEIRO on Fire! All-Time Highs Ahead !!BINANCE:NEIROUSDT has broken a key resistance level with strong volume, signaling a potential big move upward. All-time highs are within reach. Look for pullbacks or confirmation, and always use a stop loss to manage risk. This breakout could lead to major gains!
BINANCE:NEIROUSDT Currently trading at $0.0022
Buy level: Above $0.00215
Stop loss: Below $0.00177
Target : $0.006
Max Leverage 3x
Always keep Stop loss
Follow Our Tradingview Account for More Technical Analysis Updates, | Like, Share and Comment Your thoughts

NEIROETH NEW UPDATE (BEARISH)This analysis is an update of the analysis you see in the "Related publications" section
This meme coin is risky and has a lot of volatility
The previous setup is canceled
Based on the timing of the F wave, it appears that the F wave is just ending
Also, the price has hit a supply range and a bearish trend line.
This view is more correct for NEIROETH.
For risk management, please don't forget stop loss and capital management
Comment if you have any questions
Thank You

Bullish on $NEIROETH (Binance Futures)1. We have price hitting the H2 BPR AT DISCOUNT
2. We have a CISD in H2 + MSS on the lower timeframe
3. We have draws as the buyside liquidity and the ALL TIME HIGH
- Bitcoin dominance is falling hence funds have started rotating back to altcoins

#NEIRO /USDT Ready to go up#NEIRO
The price is moving in a descending channel on a 15-minute frame and sticking to it well
We have a bounce from the lower limit of the descending channel, this support is at a price of 0.001670
We have a downtrend on the RSI indicator that is about to be broken, which supports the rise
We have a trend to stabilize above the moving average 100
Entry price 0.001680
First target 0.001717
Second target 0.001749
Third target 0.001787

NEIROETH LOOKS BULLISH (NEW UPDATE)This analysis is an update of the analysis you see in the "Related publications" section
This meme coin is risky and has a lot of volatility
The supply zone specified in the previous analysis rejected the price more than 20% last time
But now with the good news we have for crypto and the state of major indexes, it seems that this scenario is happening.
We have an ABC where wave B was a diametric that ended.
The wave B trend line has been broken and the price is retesting this trend line.
By maintaining the green range, it can move towards the targets.
The red box range is a strong and important supply.
Closing a daily candle below the invalidation level will violate this analysis
For risk management, please don't forget stop loss and capital management
When we reach the first target, save some profit and then change the stop to entry
Comment if you have any questions
Thank You

NEIROETH, about to explode again soon, may retest 10x again.A new meme coin has emerged and caught the market’s attention with rapid price growth. It’s called Neiro Ethereum and is based on the OG doge meme coin.
After launching, it has risen to a staggering $193 million market cap.
But BTC and overall market selling pressure has dominated everything - and memes took the swipe too -- with so much volatility.
From peaking at a parabolic high of 0.20, NEIRO retraced heavily to an outrageously bargain zone at minus 10x levels to 0.020 zone.
Now, based on the latest daily data metrics. There is an apparent heavy accumulation at the current price range and a strong reversal to the upside is expected from here on.
At a lighter mcap now, the bargain opportunity is too tempting to be missed.
Spotted at 0.0250
Target: Back to previous peak at 0.20
TAYOR.

NEIROETH is not bullish at the moment!Note: This is a MEME COIN, it is highly volatile, control the risk.
Examining the structure, it appears to be in a major correction, which is now in wave C of this correction.
Wave C looks like a FLAT, we are now at the end of wave C of this flat.
It can move down while maintaining the red range.
Closing a daily candle above the invalidation level will violate this analysis.
For risk management, please don't forget stop loss and capital management
Comment if you have any questions
Thank You

NEIROETH LONG Scalp Trade IdeaTaking a trade for NEIROETH.
Looks like it has dropped into the 15-min key level zone and there's a chance of getting a bounce here.
This gives us a chance to have a very tight SL in place right below the key level zone. (Still a risky trade given that we have a big down candle into the zone).
Entry Price: 0.0882
SL: 0.0862
TP1: 0.0902
TP2: 0.0923
TP3: 0.0951
TP4: 0.0999
Good luck & Happy Trading!
