Update2: BTC Scalping short trading opportunity
This is the sequel to my previous idea .
The support line of the diagonal triangle has finally been broken.
The coordinate of point (A) was erroneous, so I corrected it.
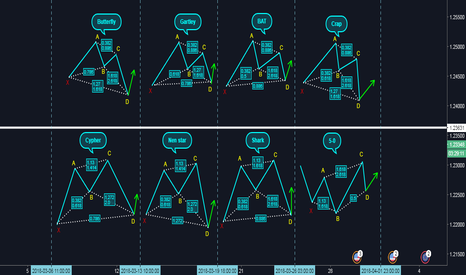
TOTAL and Nen-star patterns formed.
Recommended TPs unchanged (see also gray-color zones of the Fibonacci extension.)
For details, please take a look at the related ideas below.
Nenstar
Perfect automated detection of Shark & Nenstar PRZ - ShortA bearish-type Shark pattern occurred.
If the price rises to 0.99423, a bearish-type Nenstar pattern could occur.
Short after seeing the rebound.
*Harmonic patterns are automatically detected using the indicators below.
- Harmonic auto-detect PRO
Bullish Scenario for Blow-off Parabolic: Three Drives to TopPrevious tops characterized by parabolic surge with extreme overbought RSI (arrows). This is the Third Drive; expect another parabolic blowout, followed by an extreme Bearish reaction. This final move will complete a Nenstar pattern and likely usher in a Bear Market for 2021.
A measured move from 3230 -> 3630 of 400 pips, extended to upper TL formed by previous tops, yields price 4K.
This move could occur rapidly, over 7-10 trading sessions in December, as we saw in the two prior moves, look when RSI moved from high to extreme overbought, takes about a week.
NB: Time from 30 June ending ABC correction to next top: 64 days; from 30 October projects rally ending ~> 3 Jan
This is a rosy scenario priced for perfection. Printing free money will be the catalyst. Failure in Congress will result in rollover.
I do not advise going long here; risk is extreme! Rather, this idea suggests when shorts might come into play.
Shorting this trend is also extremely risky. Calling tops is worse than fishing for bottoms IMO!
ANYTHING can happen now; trade safe FGS!!!
As always, this is not advice, just another crackpot idea. Trade at your own risk; GLTA!
Sand P Nenstar Shark Harmonic RetracementChart says all. Expect pullback to 3390 to fill the gap at the 0.618. Might turn sooner, ofc.
"Bearish Nenstar harmonic, cousin to shark, cypher, bat/butterfly patterns; a Gartley variant. Typically the selloff from pattern completion at D is a .50 retracement"
Just an idea not advice; trade at your own risk, GLTA!
SPX Bearish Nenstar (Shark) completing at 3047-3060Bearish Nenstar harmonic, cousin to shark, cypher, bat/butterfly patterns; a Gartley variant. Typically the selloff from pattern completion at D is a .50 retracement of the CD leg up. In this case, price would be expected to drop ~150 pips to close the gap at 2864.
Nenstar and Cypher patterns are variants of Sharks. Basic form: C is lower than A. In Bearish Butterflies & Gartleys, C is higher than A.
Sharks: Nenstar D is higher than X, Cypher D is lower than X. All variants of the same theme = 'W' pattern leading to price correction.
Nice examples here: www.traderslaboratory.com
NB: Final move C-D in Nenstar may extend to 1.272 - 2.00 of A-B. In this case, 147 pips for AB x 2.00 = 3060, maximum pattern height.
This is just an idea and in no way constitutes investment advice; GLTA!!
Shark/Nen Star GBPUSD 1DHi guys,
we can see possible formation of Shark pattern and/or Nen Star pattern.
TP zones are set and can be seen on chart.
Follow price action as it gets near Fibonacci levels, and if pattern is confirmed, watch for price action and watch for EMA50 at TP levels.
Good luck while waiting.
BCH USD UPDATE --- Nen STAR?Analyzing the chart that have published a few moments ago
I would like to add a new observation and its about a possible Nen STAR formation.
If the price bounce now, break the resistance in light blue and the black one, could be a clear signal of this pattern, which could lead the price to 2,519 USD.
Any comment, observation, feeback, suggestion or teaching will be apreciated.
This is only for educational use. This is not a trading advice.
Good trade.
-SG-


