NEO

NEOUSDTHello to you all. Mars Signals team wishes you high profits at all times.
We are in a 4-hour time frame. As you can see the price fluctuates in a channel, we wait for the price to come out on one side and then enter the trade.
Warning: This is just a suggestion to you and we do not guarantee profits.
Wish you luck!

NEO/USDT Big Pump and testing 1st resistance at 45$NEO just pumped and tests the first of three big resistance lines around 45$.
Daily on the left hand side:
- The RSI moved over 70 and is now near overbought area. We expect some kind of consolidation before we move upwards again.
- The downwards trend seems broken after hovering above the lower yellow line.
- We see a volume increase during the last days.
4h on the right hand side:
- There is a golden cross involving the 50 and 200MA indicated by the yellow camera.
- We spot a strong volume spike indicated by the green spiky ball.
We expect some consolidation now which also could be very short term.
In the long term we shoot for 120$ again.
Basic rules:
- Never buy the top/ATH
- Take profit as long as you can (also partial profit is profit)
- Use Stop/loss for leveraged positions
- If you are not experienced, don't leverage in the first place
Enjoy the ride and don't be too greedy.
If you like the content, please like, comment and give this channel a follow.
We would love it if you could share your thoughts in the comments.
Discussions are very welcome here.
Always do your own research and keep in mind that my charts and comments cannot be considered financial advice.
Cheers
ps.
Chart explanation:
Main lines:
- Green lines are tested support lines.
- Orange lines are resistance lines or, if we are above, possible support lines which were not tested yet.
- Cyan line is for volume trendline.
- White lines are Fibonacci retracement levels
Helplines:
- Purple lines are trendlines we take a look at.
- Blue, green, white and pink lines are 200MA, 100MA, 50MA and 20MA.
- Yellow lines are for visual help only.
Boxes:
- Either entry zone or support zone. Check the description.


Originally Thought We'd See a Drop FirstExpected that NEO would pop up to the POC, but thought we'd see a drop first. It is now at the upper fixed range POC and oversold on the stochastic and RSI. I'm not sure I feel confident to short it, but looks like we should see it drop to bottom of TR.

NEO (NEO) - July 18Hello?
Welcome, traders.
If you "follow", you can always get new information quickly.
Please also click "Like".
Have a good day.
-------------------------------------
(NEOUSD 1W Chart)
If the price maintains above the 23.66260578-37.84723159 range, we expect the uptrend to continue.
(1D chart)
It is important to climb to the 34.13570235-43.70791888 section and get support.
If the price holds above the 43.70791888 point, it is expected that the uptrend will continue.
If it falls in the range of 23.66260578-25.99197282, there is a possibility of entering the mid- to long-term investment area, so careful trading is required.
-------------------------------------
(NEOBTC 1W chart)
You should watch for movement that deviates from the sideways section of 0.000828-0.001672.
It must rise above 0.002743 point to create a new wave.
(1D chart)
If the price finds support in the 0.000869-0.001010 range and rises to maintain the price in the 0.001010-0.001291 range, it is expected to turn into an uptrend.
If it falls from the 0.000869 point, there is a possibility of entering the mid- to long-term investment area, so careful trading is required.
------------------------------------------
We recommend that you trade with your average unit price.
This is because, if the price is below your average unit price, whether it is in an uptrend or in a downtrend, there is a high possibility that you will not be able to get a big profit due to the psychological burden.
The center of all trading starts with the average unit price at which you start trading.
If you ignore this, you may be trading in the wrong direction.
Therefore, it is important to find a way to lower the average unit price and adjust the proportion of the investment, ultimately allowing the funds corresponding to the profits to regenerate themselves.
------------------------------------------------------------ -----------------------------------------------------
** All indicators are lagging indicators.
Therefore, it is important to be aware that the indicator moves accordingly as price and volume move.
However, for the sake of convenience, we are talking in reverse for the interpretation of the indicator.
** The wRSI_SR indicator is an indicator created by adding settings and options to the existing Stochastic RSI indicator.
Therefore, the interpretation is the same as the traditional Stochastic RSI indicator. (K, D line -> R, S line)
** The OBV indicator was re-created by applying a formula to the DepthHouse Trading indicator, an indicator disclosed by oh92. (Thanks for this.)
** See support, resistance, and abbreviation points.
** Support or resistance is based on the closing price of the 1D chart.
** All descriptions are for reference only and do not guarantee a profit or loss in investment.
Explanation of abbreviations displayed in the chart
R: A point or section of resistance that requires a response to preserve profits.
S-L : Stop Loss point or section
S: A point or section where you can buy to make a profit as a support point or section
(Short-term Stop Loss can be said to be a point where profit and loss can be preserved or additional entry can be made through split trading. It is a short-term investment perspective.)
GAP refers to the difference in prices that occurred when the stock market, CME, and BAKKT exchanges were closed because they are not traded 24 hours a day.
G1 : Closing price when closed
G2: Opening price
(Example) Gap (G1-G2)

NEOUSDTHello to you all. Mars Signals team wishes you high profits at all times.
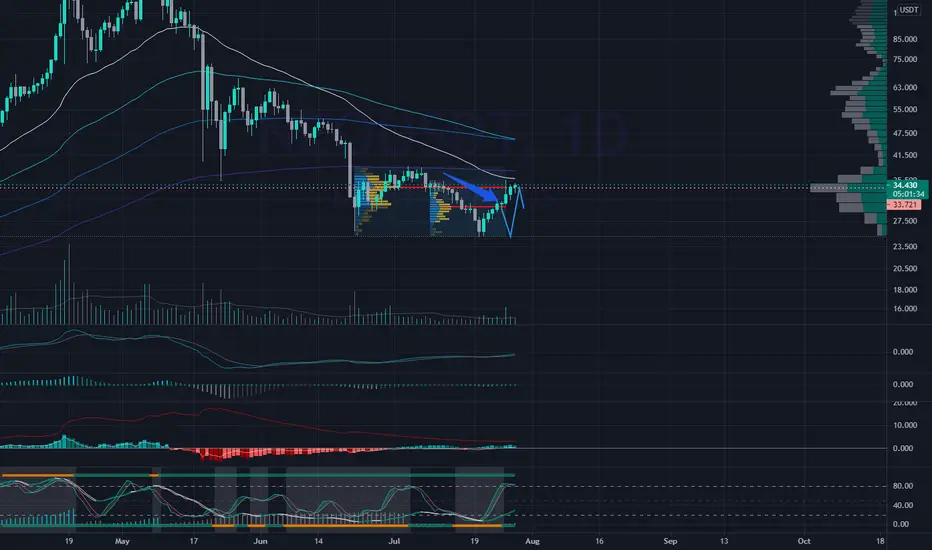
We are in a 4 hour time frame. As you can see, the price after the break of the resistance line, you see the weakness in the trend that caused the price to fall. Right now the price is moving towards support. We intend the price to be supported. And let's have a twin floor pattern and see the price increase. But if the price stabilizes below the support line, we will enter a downward phase.
Warning: This is just a suggestion to you and we do not guarantee profits.
Wish you luck!

🔥 NEO Hitting An Important Support: Reversal Incoming?Since the corona sell-off, NEO (and crypto in general) have been trending upwards. NEO has been following the violet support line for more than a year now, will it bounce off this trend line once again?
Assuming that BTC has hit the bottom, yes. Be prepared for a wick towards $25 or so. If BTC will fall further, alts could very well be decimated and a $15 NEO price could become a reality relatively soon.
Personally I'm expecting a dip in the coming days, followed up by a strong bullish reversal.
Happy trading!

It Will Be Another Giant Move Of NEO CoinBroke down the rising wedge:
On the 4-hour chart, the price action of NEO coin was moving in a rising wedge pattern and as it is a bearish reversal pattern, therefore, the price action eventually broke down the support of this rising wedge but so far did not hit the bearish targets of this rising wedge pattern and moving sideways:
On the other hand, if we take a look at the Bitcoin chart, then on the daily time frame after breaking down the support of the rsing wedge on the daily time frame, the bitcoin is also moving sideways. Therefore the NEO is also following the move of Bitcoin.
BTC rising wedge
Support and resistance levels and SMAs:
On the weekly time frame chart, it can be clearly seen that after being rejected by the $130 resistance level the price action has moved down at $29 to $30. This is very strong supports and because previously it has been working as a support and resistance as well.
The priceline of NEO is also moving around 50 simple moving average on the weekly time frame chart and after 50 SMA there is also 100 simple moving average above the support of $20.
Big bullish Cypher pattern:
On the weekly time frame chart, NEO has formed a bullish harmonic bullish Shark pattern. The 1.13 Fib level is in the negative territory, therefore it is not possible for the priceline to move there, however, there is strong support at $12.50. Therefore, we can set the buying zone accordingly as below. There is also 100 simple moving average support in the buying zone which can be used as a stop loss for the long-term trade. The buying and sell targets as per this pattern can be as below:
Buy between: $26.08 to $12.50
Sell between: $51.64 to $110.057
As per the above targets, this trade has a big profit possibility up to 780% but if you consider the buying zone max up to 100 SMA then profit possibility can be upto 390%.


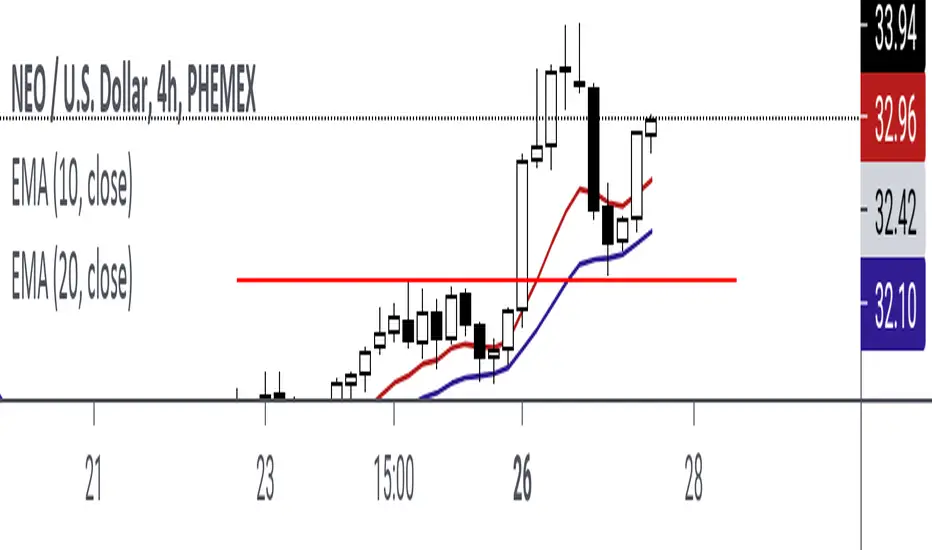
Neo scalphello everyone.
we can open a long position if its fixed above Ema 20.
it is not a piece of financial advice always do your research.

NEOThe NEO currency is a strong investment currency
It is expected that the wave is at the end of the correction and we will see a rise soon
The objectives are as described in the analysis
Don't forget about risk management
Good Luck
Do not forget to support the idea by clicking on the like button and sharing your opinion in the comment box
NEO Old Signal

NEO/USD: Upward breakout possible (3W).Upward breakout possible on pattern 3W. Bitcoin is also forming pattern 3W up.
In general, altcoins are growing more actively than bitcoin:
What is a signal in favor of price growth.


NEOUSDTHello to you all. Mars Signals team wishes you high profits at all times.
We are in a 4 hour time frame. As you can see, we are in a bearish channel and the price has been able to break the resistance and is fluctuating inside the channel. We expect the price to reach the ceiling of the channel and we can save. And if the ceiling is broken and re-established, we will enter into a deal. We have identified resistance and support for you.
Warning: This is just a suggestion to you and we do not guarantee profits.
Wish you luck!

NEOUSD, Forms Crucial Ascending-Wedge, Important Considerations!Hello Traders Investors And Community,
Welcome to this analysis about NEOUSD, looking at the 4-hour timeframe perspectives. As the cryptocurrency market divergence increases more there are coins forming formation with a rather bullish edge, coins that have a more neutral structure and coins that have a high-possibility bearish development structure. With NEOUSD it is the case that NEOUSD is in a decisive formational structure that has a increased bearish edge which should not underestimated here, especially with the formation that I recently detected this can lead to an initial breakout to the downside and approaching of the lower supports before a back-out can emerge, therefore it is important to be prepared on such possible volatilities and in this case I detected all the important levels.
As when looking at my chart now we can watch there that NEOUSD firstly established this decisive ascending-wedge-formation in the structure with the coherent wave-count in the wedge-formation and the waves A to D already finished, now with the approaching of the lower boundary of the wedge this will be the likely origin of the wave E to the upside that will move on and finalize the wave-count. The crucial thing is that NEOUSD then will run directly into this dynamic resistance-cluster marked in my chart in red which is forming in between the descending-trend-line and the 100-EMA in red, as this is a range of accumulated supply it is likely that NEOUSD shows a pullback from there which will move on and complete the wedge-formation to the downside, such a breakout will activate the lower targets and NEOUSD will likely reach them in the upcoming times. This does not mean NEOUSD is completely bearish as there is a solid support base from where it can back-up and show further increased demand with bullish developments.
In this manner, thank you for watching my analysis about NEOUSD and its decisive ascending-wedge-formation with the upcoming scenarios to consider, will be great when you support it with a like and follow or comment, great contentment for everybody supporting, all the best!
"The high destiny of the market is to explicate, rather than to speculate."
Do you have a favorite altcoin? Let me know in the comments, potentially I analyze it in the future.
Information is only educational and should not be used to take action in the market.

NEO (NEO) - July 1Hello?
Welcome, traders.
By "following", you can always get new information quickly.
Please also click "Like".
Have a good day.
-------------------------------------
(NEOUSD 1W Chart)
If the price is maintained above the 37.84723159 point, it is expected to turn into an uptrend.
(1D chart)
It remains to be seen if the 34.13570235-43.70791888 section can support and rise.
If the price is maintained above the 43.70791888 point, we expect the uptrend to continue.
-------------------------------------
(NEOBTC 1W chart)
To convert into an uptrend, it needs to rise above the 0.001236 point and find support.
We'll have to wait and see if we can get out of the boxed section of 0.000828-0.001672.
(1D chart)
We will have to hold the price in the 0.001010-0.001291 range to see if it can turn into an uptrend.
If it goes down, you should check to see if it finds support in the 0.0000868-0.001010 zone.
------------------------------------------
We recommend that you trade with your average unit price.
This is because, if the price is below your average unit price, whether it is in an uptrend or in a downtrend, there is a high possibility that you will not be able to get a big profit due to psychological burden.
The center of all trading starts with the average unit price at which you start trading.
If you ignore this, you may be trading in the wrong direction.
Therefore, it is important to find a way to lower the average unit price and adjust the proportion of the investment, ultimately allowing the funds corresponding to the profits to regenerate themselves.
------------------------------------------------------------ -----------------------------------------------------
** All indicators are lagging indicators.
Therefore, it is important to be aware that the indicator moves accordingly with the movement of price and volume.
However, for the sake of convenience, we are talking in reverse for the interpretation of the indicator.
** The wRSI_SR indicator is an indicator created by adding settings and options to the existing Stochastic RSI indicator.
Therefore, the interpretation is the same as the traditional Stochastic RSI indicator. (K, D line -> R, S line)
** The OBV indicator was re-created by applying a formula to the DepthHouse Trading indicator, an indicator disclosed by oh92. (Thanks for this.)
** See support, resistance, and abbreviation points.
** Support or resistance is based on the closing price of the 1D chart.
** All descriptions are for reference only and do not guarantee a profit or loss in investment.
Explanation of abbreviations displayed in the chart
R: A point or section of resistance that requires a response to preserve profits.
S-L: Stop Loss point or section
S: A point or section where you can buy to make a profit as a support point or section.
(Short-term Stop Loss can be said to be a point where profit and loss can be preserved or additional entry can be made through split trading. It is a short-term investment perspective.)
GAP refers to the difference in prices that occurred when the stock market, CME, and BAKKT exchanges were closed because they are not traded 24 hours a day.
G1 : Closing price when closed
G2: Opening price
(Example) Gap (G1-G2)


NEO/USDT = Long Term Investment IdeaNEO can be called another strong project on the market, which has passed several business cycles.
The price of the asset is under selling pressure and has corrected to the price values of February.
Currently, it is better to wait with purchases.
A long-term position is better to form in the range of $21.68 - $29.60.
It is better to place the hedging order in the range of $15.55 - $19.08.
The stop loss should be calculated depending on the money allocated to the transaction, and do not forget that it is better to keep no more than 10% of your deposit in one asset.
Target price levels will be
$45,22
$54,80
$64,00
$78,00
$88,00
Good luck and watch out for the market!
P.S. This is an educational analysis that shall not be considered financial advice

