NEOBTC / D1 / TECHNICAL CHARTPATTERN IDENTIFICATION: FLAG
*Classic chart patterns*
*When we hit TP1 move your stop loss to the entry point*
*I AM NOT A CRYPTO INVESTOR. I AM A TRADER*
NEOBTC

NEO is losing support and might drop MORECurrently NEO has little or not support at all, if Bitcoin BTC drops a lot, it might cause NEO to fall to the previous high before last year bull run, or 0.00075 btc area.
One thing that can save NEO, is if BITCOIN breaks out of the current falling wedge is forming.
I think in general all crypto will take several months of correction and slow grow. We need more adoption.
Have you ever see anyone in the streets using NEO as a payment? No? that means we need more adoption.
What do you think?
Don't forget to leave my a like and to follow me
Good luck

Regardless of the current bitcoin condition, this coin is in gooHi Dears,
The condition of this coin is good
At the bottom of the price and somehow it's time to buy
But there are two negative things
Bitcoin conditions are not good
In the event of a rise in price, the coin would not be profitable in the short term
The decision is with you, but be careful if you buy this coin
But remember that nothing in this world is 100%
Good Luck


Neo Long...cant beleive i am saying it
Ok, for me Neo still may well fall back again but i think here would be a good risk reward scenario, against btc neo broke through the moving averages i use on the 144 minute interval, so it stands a good chance of good performance against BTC
since NEO will usually move more violently in either direction than btc it leads me to think that any rises in BTC will see nice larger gains in NEO
Also i draw my predicted rout against usd

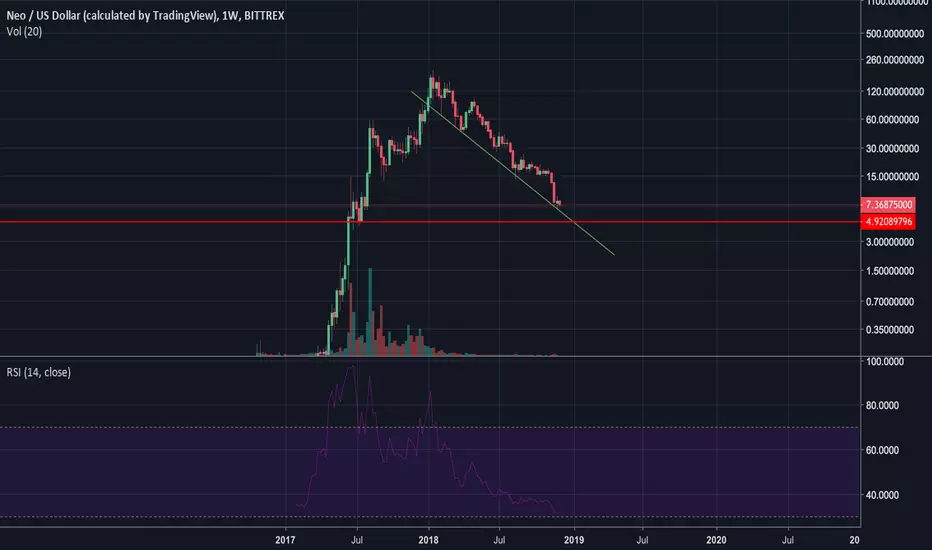
Looking for Neo bottom? I think not yetLet me put this simple, there's no long-term bullish sign whatsoever. There might be a bounce but I'm almost certain that Neo will find another lower low which is very likely is the 4.5$ - 5$. Let look at some indicators.
1/ Volume doesn't kick in yet.
2/ Weekly RSI still have some more space to go.
3/ Still not hit any strong & solid support.
Is 4.5$ - 5$ is the absolute bottom for Neo, I can't guarantee, but if you're looking for a good short & mid-term trade with very low risk & high profit, this is definitely one of it.
How to play:
Layer your buys at 4.5$ - 5$.
NEOBTC - Monthly ChartThe monthly chart of neobtc looks pretty dangerous, if you're bullish on the NEO project.
Risk averse traders better stay out of NEO at the moment. If you look at weekly/daily levels, you'll see NEO is hanging on the cliff of at least 90% more downwards movements.
However, risk-loving traders might see this as an opportunity. A recovery of NEO might lead to a bounce of 30%. With a tight stop-loss, there are possibilities..

NEOBTC - Monthly Chart. This does not look very well..The monthly chart of neobtc looks pretty Risky.
Risk averse traders better stay out of NEO at the moment. If you look at weekly/daily levels, you'll see NEO is hanging on the cliff of at least 80% additional downwards movements.
However, risk-loving traders might see this as an opportunity. A recovery of NEO might lead to a bounce of 30%. With a tight stop-loss, there are possibilities..

NEO Long Term TradeHey friends!
Looking to accumulate NEO in this price range for long term!
All the best!


Daily Bullish Signal $NEO #NEO NEO/BTC (03 Dec)BLUE ARROW indicates the EXPECTED Time and Targets
Level Stoploss point up to maximize profit and reduce risk
I'm working all the time, even in Bearish Market


USDT -NEO -Alt Coin Analysis - Point SystemAlt Coin Analysis - Points out of 10
Date : Since 2015 ( 7 / 10 )
Volume 24 H : 30000 BTC ( 8 / 10 )
Available Markets* ( 8 / 10 )
Social Media Rate ( 7 / 10 )
Ranks **15 ( 9 / 10 )
Website ( 6 / 10 )
Type Blockchain with SmartContracts - Chinese ETH
Overall ( 7 /10 )
My old friend - AntShares . On Nov 2016, I met with you . Time is flying.
I sold you such a long time. I am waiting to buy you again at 220,000 satoshi.
$10 - $16 levels are great to accumulate some!
* Considering top 10 crypto exchanges
** Top 100 coins on coin market cap get 10 points


NEOBTC Technical Analysis 425% target ProjectionYou can see the Chart of NEOBTC on Weekly Timeframe .
It Seems Like correction period is almost End.
I have Mention Support and resistance levels on Chart
Note: This is only for Educational Purpose this is not an Investment advice.
Please support the setup with your likes, comments and by following on Trading View.
Thanks
Adil Khan


NEO my nemesis Call me crazy. I think we have the bottom. I bought some 20% ago and well stuck with my choice. If only I could see in the future id be good. But lets how this goes. BS loss if I sell. WQill be okay in the future should I not get a margin call :|


NEOBTC Technical Analysis 325% target ProjectionYou can see the Chart of NEOBTC on Daily Timeframe .
It Seems Like correction period is almost End.
Market Break the falling wedge pattern.
Now Moving in Sideway.
I have Mention Support and resistance levels on Chart
Note: This is only for Educational Purpose this is not an Investment advice.
Please support the setup with your likes, comments and by following on Trading View.
Thanks
Adil Khan

