For Education Purpose ''Not Fınancıal Advise''The given chart represents the changes of price from approximately 141K to 24K. As we can see that there is a fall channel, so we can expect going down for Neousdt.
Neousd

NEO/USD: Upward breakout possible (3W).Upward breakout possible on pattern 3W. Bitcoin is also forming pattern 3W up.
In general, altcoins are growing more actively than bitcoin:
What is a signal in favor of price growth.

NEOUSD, Forms Crucial Ascending-Wedge, Important Considerations!Hello Traders Investors And Community,
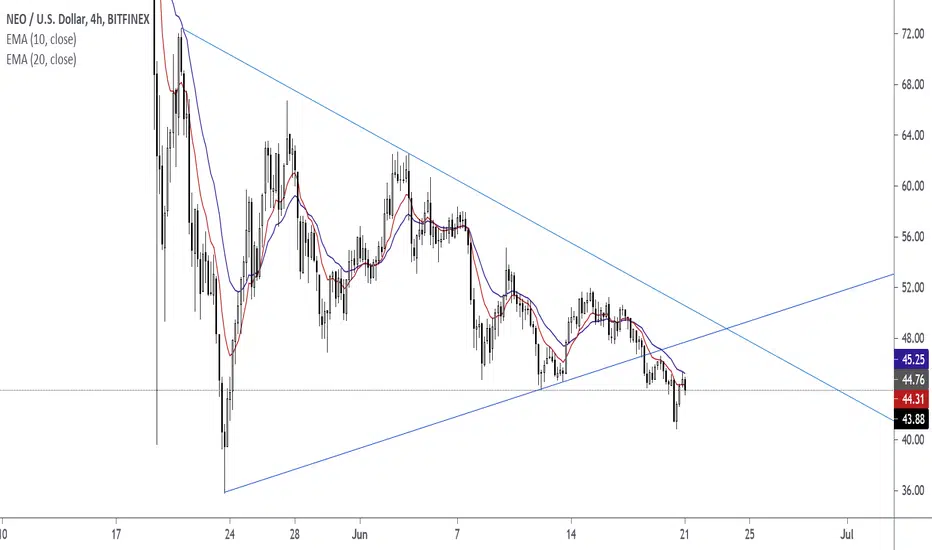
Welcome to this analysis about NEOUSD, looking at the 4-hour timeframe perspectives. As the cryptocurrency market divergence increases more there are coins forming formation with a rather bullish edge, coins that have a more neutral structure and coins that have a high-possibility bearish development structure. With NEOUSD it is the case that NEOUSD is in a decisive formational structure that has a increased bearish edge which should not underestimated here, especially with the formation that I recently detected this can lead to an initial breakout to the downside and approaching of the lower supports before a back-out can emerge, therefore it is important to be prepared on such possible volatilities and in this case I detected all the important levels.
As when looking at my chart now we can watch there that NEOUSD firstly established this decisive ascending-wedge-formation in the structure with the coherent wave-count in the wedge-formation and the waves A to D already finished, now with the approaching of the lower boundary of the wedge this will be the likely origin of the wave E to the upside that will move on and finalize the wave-count. The crucial thing is that NEOUSD then will run directly into this dynamic resistance-cluster marked in my chart in red which is forming in between the descending-trend-line and the 100-EMA in red, as this is a range of accumulated supply it is likely that NEOUSD shows a pullback from there which will move on and complete the wedge-formation to the downside, such a breakout will activate the lower targets and NEOUSD will likely reach them in the upcoming times. This does not mean NEOUSD is completely bearish as there is a solid support base from where it can back-up and show further increased demand with bullish developments.
In this manner, thank you for watching my analysis about NEOUSD and its decisive ascending-wedge-formation with the upcoming scenarios to consider, will be great when you support it with a like and follow or comment, great contentment for everybody supporting, all the best!
"The high destiny of the market is to explicate, rather than to speculate."
Do you have a favorite altcoin? Let me know in the comments, potentially I analyze it in the future.
Information is only educational and should not be used to take action in the market.

NEO (NEO) - July 1Hello?
Welcome, traders.
By "following", you can always get new information quickly.
Please also click "Like".
Have a good day.
-------------------------------------
(NEOUSD 1W Chart)
If the price is maintained above the 37.84723159 point, it is expected to turn into an uptrend.
(1D chart)
It remains to be seen if the 34.13570235-43.70791888 section can support and rise.
If the price is maintained above the 43.70791888 point, we expect the uptrend to continue.
-------------------------------------
(NEOBTC 1W chart)
To convert into an uptrend, it needs to rise above the 0.001236 point and find support.
We'll have to wait and see if we can get out of the boxed section of 0.000828-0.001672.
(1D chart)
We will have to hold the price in the 0.001010-0.001291 range to see if it can turn into an uptrend.
If it goes down, you should check to see if it finds support in the 0.0000868-0.001010 zone.
------------------------------------------
We recommend that you trade with your average unit price.
This is because, if the price is below your average unit price, whether it is in an uptrend or in a downtrend, there is a high possibility that you will not be able to get a big profit due to psychological burden.
The center of all trading starts with the average unit price at which you start trading.
If you ignore this, you may be trading in the wrong direction.
Therefore, it is important to find a way to lower the average unit price and adjust the proportion of the investment, ultimately allowing the funds corresponding to the profits to regenerate themselves.
------------------------------------------------------------ -----------------------------------------------------
** All indicators are lagging indicators.
Therefore, it is important to be aware that the indicator moves accordingly with the movement of price and volume.
However, for the sake of convenience, we are talking in reverse for the interpretation of the indicator.
** The wRSI_SR indicator is an indicator created by adding settings and options to the existing Stochastic RSI indicator.
Therefore, the interpretation is the same as the traditional Stochastic RSI indicator. (K, D line -> R, S line)
** The OBV indicator was re-created by applying a formula to the DepthHouse Trading indicator, an indicator disclosed by oh92. (Thanks for this.)
** See support, resistance, and abbreviation points.
** Support or resistance is based on the closing price of the 1D chart.
** All descriptions are for reference only and do not guarantee a profit or loss in investment.
Explanation of abbreviations displayed in the chart
R: A point or section of resistance that requires a response to preserve profits.
S-L: Stop Loss point or section
S: A point or section where you can buy to make a profit as a support point or section.
(Short-term Stop Loss can be said to be a point where profit and loss can be preserved or additional entry can be made through split trading. It is a short-term investment perspective.)
GAP refers to the difference in prices that occurred when the stock market, CME, and BAKKT exchanges were closed because they are not traded 24 hours a day.
G1 : Closing price when closed
G2: Opening price
(Example) Gap (G1-G2)


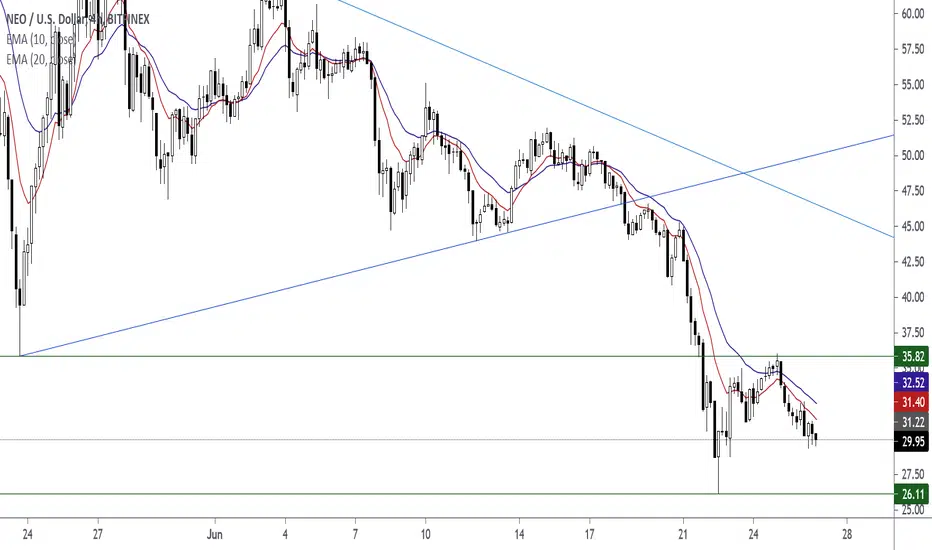
Still bearish on NEO NEOUSDIndeed. Neo failed to establish a new impulse, unfortunately. Albeit strong recent drops, too little time has passed to make on viable anyway. Looking at the charts, initial goal is the red dashed line and then we will reassess. But remember, this is not financial advice, just like all our other posts. Please do your own research first and then make decisions based on that.


NEO (NEO) - June 10Hello?
Welcome, traders.
By "following", you can always get new information quickly.
Please also click "Like".
Have a good day.
-------------------------------------
(NEOUSD 1W Chart)
I think it's good to keep the price above the 50.22168635 point to create a new wave.
If it falls below the 23.66260578 point, it may take a long time to rise as it enters the long-term investment realm, so trade cautiously.
To create a new wave, we need to break out of the downtrend line, so we have to watch to see if it follows the uptrend line.
(1D chart)
You have to wait for the movement to rise above the 81.99678728 point after going sideways in the section 43.70791888-62.85235308.
To transition into an uptrend, it needs to rise above the 58.57620000 point and find support.
However, in order to accelerate the upward trend, it must rise above the 81.99678728-91.56900381 section.
If it falls in the 34.13570235-43.70791888 section, Stop Loss is required to preserve profit and loss.
However, it can touch the 23.66260578 point and can rise, so trade cautiously.
-------------------------------------
(NEOBTC 1W chart)
It remains to be seen if we can create a new wave that rises above the 0.002858 point.
If the price holds above the 0.001236 point, I think it is more likely to move along an uptrend line.
If it falls below the 0.001236 point, I think it will likely take a long time to rise as it is entering the long-term investment realm.
Therefore, careful trading is required.
(1D chart)
We should see support at the 0.001291 point and see if we can move higher.
If it falls from the 0.001291 point, Stop Loss is required to preserve profit and loss.
However, it may follow an uptrend line, so you need to trade cautiously.
To convert into an uptrend, it needs to rise above the 0.001572 point and find support.
------------------------------------------
We recommend that you trade with your average unit price.
This is because, if the price is below your average unit price, whether it is in an uptrend or in a downtrend, there is a high possibility that you will not be able to get a big profit due to psychological burden.
The center of all trading starts with the average unit price at which you start trading.
If you ignore this, you may be trading in the wrong direction.
Therefore, it is important to find a way to lower the average unit price and adjust the proportion of the investment, ultimately allowing the funds corresponding to the profits to regenerate themselves.
------------------------------------------------------------ -----------------------------------------------------
** All indicators are lagging indicators.
Therefore, it is important to be aware that the indicator moves accordingly with the movement of price and volume.
However, for the sake of convenience, we are talking in reverse for the interpretation of the indicator.
** The wRSI_SR indicator is an indicator created by adding settings and options to the existing Stochastic RSI indicator.
Therefore, the interpretation is the same as the traditional Stochastic RSI indicator. (K, D line -> R, S line)
** The OBV indicator was re-created by applying a formula to the DepthHouse Trading indicator, an indicator disclosed by oh92. (Thanks for this.)
** See support, resistance, and abbreviation points.
** Support or resistance is based on the closing price of the 1D chart.
** All descriptions are for reference only and do not guarantee a profit or loss in investment.
Explanation of abbreviations displayed in the chart
R: A point or section of resistance that requires a response to preserve profits.
S-L: Stop Loss point or section
S: A point or section where you can buy to make a profit as a support point or section.
(Short-term Stop Loss can be said to be a point where profit and loss can be preserved or additional entry can be made through split trading. It is a short-term investment perspective.)
GAP refers to the difference in prices that occurred when the stock market, CME, and BAKKT exchanges were closed because they are not traded 24 hours a day.
G1 : Closing price when closed
G2: Opening price
(Example) Gap (G1-G2)

wait for NEOUSDT upcoming...Here is a good strategy for NEOUSDT to enter and Hold for a long time.
but, Don`t miss MA26, In my humble opinion:
The best target to enter: 39.829
The best target to close (with lower risk): 50.000
--------------------------------------------------------------
Have a great day >_-

Short Position: NEO break out this simetric triangle!!!I wil put a short position in NEO from $54 USD to sell order limit until the $28 USD, this will be my final target approximately. NEO it's look bearish in H4 timeframe and H12 timeframe.
s3.tradingview.com
This it's the Daily timeframe and I believe that buy NEO contract will be an error, because as Bitcoin dump, NEO follow Bitcoin.
s3.tradingview.com
But if you look the H4 timeframe, NEO form like a simetric triangle, and that will be considered a bearish signal. For that ,I decide to sell NEO as I have a perspective that cryptocurrencies going to crash!!!
Good luck!!!


IS NEOUSD READY FOR $100 AGAIN? #BLESSEDPIPSWITH A STRONG HOLD AT SUPPORT AND A LOT OF POSITIVE CRYPTO NEWS THIS WEEKEND. THINGS ARE LOOKING POSITIVE, LETS SEE WHAT HAPPENS.
#BLESSEDPIPS

I decide to buy NEO contract; why?Looking the Daily chart, NEO it's in the accumulation zone that you can to buy this cryptocurrency to hold or buy in contract to leverage with NEO/USD. This cryptocurrency it's show us a good trade to keep to medium term. That mean that in medium term, you can to earn a lot money if you keep this position to $130 USD. But using my broker Simple FX to accumulating more Cardano coins. Also, I want to show you my own strategy if you want to accumulate Cardano in Simple FX in my others post. Remember, my goal it's to reach my 20,000 ADA coins.
Now, looking in the Daily timeframe, NEO form a simetri trianlge in the key spport line, this line it's a good point that you can to invest in NEO or buy contract leverage in your trading, and alos that NEO make support in the $47 USD and $55 USD. That it's a key zone that you can to buy NEO contract or investment. But that it's my prediction how I see NEO in medium term to go back to $130 USD. Right now, NEO price it's around of $55 USD.
I entry in the market price until the target at $130 USD and SL around of $42 USD. i just buy 16 NEO contract to keep this position to long.
s3.tradingview.com
And also, you can to watch the 3 Daily timeframe, it's look bullish too.

NEO to invest in this cryptocurrency!!! Know this informationNEO it's a cryptocurrency that soudn interesting to invest. Personally, I do not invest in NEO as this cryptocurrency are not in the top 20. But yes, if you look NEO as invesment, you can to invest in this cryptocurrency. I show you my 3 targets that I considered or who hold NEO.

NEO Up or DownWe could break the triangle either direction at this point. Volume seems relative, no real revelations there. MacD is about to get a crossover on the daily which could lend to the more bullish perspective here at least for the short term.
Many coins are in this pattern and in general most look like a bearish pennant. But when looking from weekly perspective things looks more bullish. My main question is WHO WILL BE BUYING? In the US people have already used up their stimulus checks, and many people were burnt by the big drop recently. I can't imagine that many retail investors have been sitting on the sidelines waiting for this pullback, since most newbies FOMO in at the top just like the institutions like.
Curious to hear any input anyone has about where the new buyers will come from.
👇👇👇👇Join the discussion👇👇👇👇


NEOUSDTHello to you all. Mars Signals team wishes you high profits at all times.
The price has been able to break its resistance line and is fluctuating. We have drawn a channel line for you that can move from any side of the price. We have identified the area of support and resistance for you.
Warning: This is just a suggestion to you and we do not guarantee profits.
Wish you luck!
