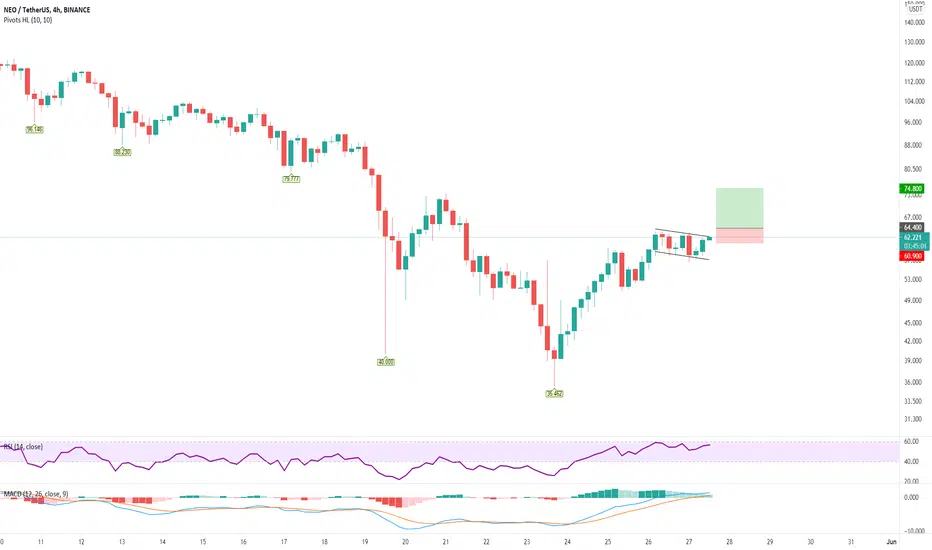
NEO Buy a break setup.NEOUSDT - Intraday - We look to Buy a break of 64.4 (stop at 60.9)
Posted a bullish Flag formation.
A break of 64.0 is needed to confirm the outlook.
Short term momentum is bullish.
The bias is to break to the upside.
We look for gains to be extended today.
Our profit targets will be 74.8 and 78.8
Resistance: 64.0 / 72.0 / 75.0
Support: 58.0 / 52.0 / 47.0
Neousd

NEO Potential Profit Target $250 to $280 if Break UPHere I've plotted 3 fib extensions. The first two are from completed impulses up and the third is a profit target. If we hit the 1.608 and/or the 2.0 level again, take profit is between $250 and $280.
Fundamentally NEO is a solid project with an upcoming major mainnet release.

NEOUSD has no great strength but can start to riseMy Marketmiracle advisor generated an input signal for NEOUSD for the price of 98.13
The interest of average buyers on NEO is returning, who have been overwhelmed by panic selling.
There is not a big push but you can think of a target of 104.34 .. to begin with.
If you want to see all the Marketmiracle input and output signals, visit marketmiracleadvisor.com is a free service.

NEO/USDTAs a Beginner learner, tries to share my opinion in order to verify it in the future to learn from my mistakes and to reward myself if I found that I was right.
If possible, follow me and correct my mistakes so that I can learn from you.
I am a new learner in the cryptocurrencies domaine, and my analysis are not investment advice to anyone, I just want to save an archive of my analyzes in order to monitor my learning level.
thank you so much


NEO/USDT booked 231% pure profit guys#NEO/USDT Profit Update:-
$NEO currently trading at $100 and went upto $134
And our entry was $41
So total 231% pure profit guys.
Entry:- $41 ✅
TP1:- $55 ✅
TP2:- $70 ✅
TP3:- $83 ✅
TP4:- $100 ✅
Congrats guys who booked huge Profit.
I forgot to update and mention profit update.
Always learn and earn.
I already sold my All $NEO
Still I am not holding any $NEO
But still expect $200 also.
( Risk reward very high )
Please click like button and Appreciate my hard work.
Must follow me for latest crypto real time updates.
Thank you.

Don't Sleep on Flamingo. And don't sleep with a Flamingo EitherWith the upcoming release of NEO 3.0. Flamingo (Da Hong Fei's DeFi project) will likely boom when/if neo blasts past ATH soon. Today's dip, FLM has held steady with SMA 20 as support. I hope to see this breakout soon.
Let me know in the comments which coins you like currently.
👇👇👇👇Join the discussion👇👇👇👇

NEO (NEO) - May 12Hello?
Dear traders, nice to meet you.
By "following" you can always get new information quickly.
Please also click "Like".
Have a good day.
-------------------------------------
(NEOUSD 1W chart)
(1D chart)
We have to see if we can ascend above the 120.28565454 point.
If it goes down, you need to make sure you get support at 109.08891509.
If you decline at 100.25260977, you need a short stop loss.
If you fall at 81.99678728, you need Stop Loss to preserve profit and loss.
However, you can touch the 70.94800755-79.70498226 interval and go up, so you need to trade carefully.
If you gain support and climb in the 70.94800755-79.70498226 section, you can enter the section.
------------------------------------
(NEOBTC 1W chart)
(1D chart)
It remains to be seen if it can rise above the 2133 Satoshi point along the uptrend line.
If it falls, we need to make sure it is supported by the 1963 Satoshi branch.
If it falls at 1309 Satoshi, Stop Loss is needed to preserve profit and loss.
--------------------------------------
It is advisable to trade at your average unit price.
This is because if the price flows below your average unit price, which was on an uptrend or downtrend, there is a high possibility that you will not be able to earn a large profit due to the psychological burden.
The center of every trade starts with the average unit price you start trading.
If you ignore this, you may be trading in the wrong direction.
Therefore, it is important to find a way to lower the average unit price and adjust the proportion of the investment, so that the money that ultimately corresponds to the profit can regenerate the profit.
-------------------------------------------------- -------------------------------------------
** All indicators are lagging indicators.
So, it's important to be aware that the indicator moves accordingly with the movement of price and volume.
Just for the sake of convenience, we are talking upside down for interpretation of the indicators.
** The wRSI_SR indicator is an indicator created by adding settings and options from the existing Stochastic RSI indicator.
Therefore, the interpretation is the same as the conventional stochastic RSI indicator. (K, D line -> R, S line)
** The OBV indicator was re-created by applying a formula to the DepthHouse Trading indicator, an indicator that oh92 disclosed. (Thank you for this.)
** Check support, resistance, and abbreviation points.
** Support or resistance is based on the closing price of the 1D chart.
** All explanations are for reference only and do not guarantee profit or loss on investment.
Explanation of abbreviations displayed on the chart
R: A point or section of resistance that requires a response to preserve profits
S-L: Stop Loss point or section
S: A point or segment that can be bought for profit generation as a support point or segment
(Short-term Stop Loss can be said to be a point where profits and losses can be preserved or additionally entered through installment transactions. It is a short-term investment perspective.)
GAP refers to the difference in prices that occurred when the stock market, CME, and BAKKT exchanges were closed because they do not trade 24 hours a day.
G1: Closing price when closed
G2: Cigar at the time of opening
(Example) Gap (G1-G2)

Flamingo Back to initial Entry Price + BULLISH Ascening Triangle#flamingo #flm Forming a massive ascending triangle on the daily. We are also back at the entry price for Flamingo. Breakout looks imminent in my opinion as long as the money keeps flowing in to TOTAL2. We should see FLM continue to pump as long as NEO is pumping and prior to NEO 3 release.


NEO MASSIVE POTENTIAL Looking at the HTF, NEO has massive potential, the chart looks similar to the one of DASH
First i'd like to see $48 flipped to support and hold

NEOO buy now will pump again for few hours prepare.NEOO buy now will pump again for few hours prepare.


NEO is about to explode soonNEO is about to explode very soon. I would set the main target about U$ 170 looking fibonnaci x chart pattern

NEO BULLISH to ATH or HIGHERAll indicators are currently bullish and the $94 resistance has already been tested. We are now establishing new support at the $120 mark with squeeze indicator and MACD looking very bullish .
I believe next push could be to ATH of $200 or possibly above before a massive retrace back to $120.
Alternatively we may see support build at $200 with a lot of new buyers coming in after long time ath bag holders release and recoup their investment thinking that’s th safe time to exit. New players will be coming.
👇👇👇👇Join the discussion👇👇👇👇


NEO $94 Strong SupportThis should be a great opportunity to buy the dip on NEO. $94 should prove as strong support. Of course, this is crypto, so take it with a grain of salt. Peace.
👇👇👇👇Join the discussion👇👇👇👇


