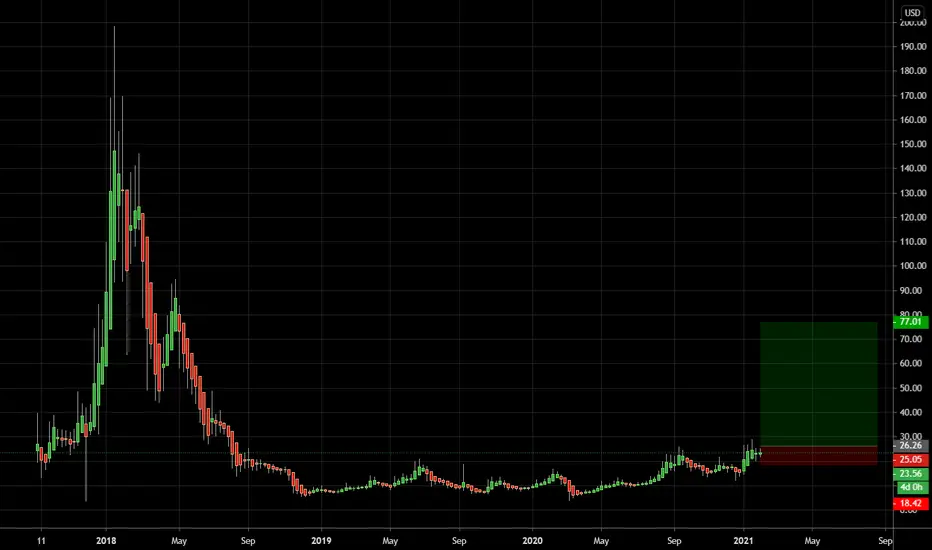
NEO - $100 THIS YEAR!!Neo one of the best performing coins of 2017, and in fact one of the first coins to explode in 2017 is looking at making a comeback in 2021. Neo has a very similar chart pattern to many other coins including WANCHAIN, that being a golden gross on the weekly as well as an Ichimoku cloud breakout and long term pennant breakout!
Neo could definitely see $100 this year.
As always let me know what you guys expect Neo to reach this year
''Buy Big Sell BIGGER'' - MegaWhale
Neousd


Trail Stop Loss To Next Target 134.98 | NEOUSDNEOUSD Target 94.65 Achieved. Trail Stop Loss To Next Target 134.98


NEO 250% profit , updatecheck related idea down below , we bought neo at 22$
it reached our second target with 250% profit , i think that we may have a correction wich wont be bearish
if i dont see any bearish signs in market ill add more neo if correction happens


NEOUSDT(4H) Next Target!NEOUSDT(4H Chart) Technical Analysis Update
NEO/USDT currently trading at $68
Buy-level: Above $69 (Buy after breakout)
Stop loss: Below $62
Target 1: $80
Target 2: $95
Max Leverage: 3X
ALWAYS KEEP STOP LOSS...
Follow Our Tradingview Account for More Technical Analysis Updates, | Like, Share and Comment Your thoughts.

NEO 12h Are we going to continue to grow to $100?Almost 2 months, since the publication of the previous idea, have not looked towards NEO
However, over the weekend, there was a notification that the NEOUSDT price reached the target from the previous idea, which means that we need to update our thoughts.
As can be seen from the previous idea, after an uncertain growth, the NEOUSDT price was expected to fall sharply, but t he $35.5 level fulfilled its role of support. The level was broken three times by false breakouts, most likely on liquidation of margin positions, however, interested players closed the bodies of Japanese candlesticks above the critical level to preserve the long sentiment.
And although we do not consider ourselves in the cohort of long-term holders of various projects, patient investors could fix the first good profit on NEOUSD
Now the most probable are 2 scenarios:
1. Slight correction above $60 and continued rapid growth to $95
2. A deeper correction can give a tasty price for buying long, but the target from above will be a little more modest $85
Share in the comments the fundamental news that can help the coin's growth
_______________________________
Since 2016, we have been analyzing and trading the cryptocurrency market.
We transform our knowledge, trading moods and experience into ideas. Each "like under the idea" boosts the level of our happiness by 0.05%. If we help you to be calmer and richer - help us to be happier :)

NEOUSDT good for buy!!NEOUSDT (1H Chart) Technical Analysis Update
Resistance become support
NEO/USDT currently trading at $64.00
Buy-level: $63.45 - $64.00
Stop loss: Below $61.10
Target 1: $66.50
Target 2: $68.50
Target 3: $70.00
Max Leverage: 3X
ALWAYS KEEP STOP LOSS...
Follow Our Tradingview Account for More Technical Analysis Updates, | Like, Share and Comment Your thoughts.


NEO/USDT now 52% up from our entry and still my TP is $100#NEO/USDT profit update:-
$NEO currently trading at $63
Which is 52% up from our entry zone.
Congrats who bought and still enjoying the profit ride.
Entry:- $41 ✅
TP1:- $55 ✅
TP2:- $70 pending ( hit $65 )
Still $100 Potential coin $NEO
If you want to safe play than you can sell 20-30% positions.
Support:- $55/$44
Resistance:- $70/$83/$94
Please click LIKE button and Appreciate my hard work.
Must follow me for latest crypto real time updates.
Thank you.

NEOUSDT finally broke previous resistance zone upto 250% to ATH ALT season + Defi platform + Chinese Ethereum + lagging until now can only mean that its about to explode

NEOUSD Target Price 63.62Next Target is 63.62. Trail Stop Loss. Look for price action signal Inside Bar on the lower time frame to enter another position.

NEO looks cool😉Hello, my dear friends!
For me NEO looks like going up!
Wanna share with You not bad opportunity 😊
Happy trading 💋
I try to be useful to You🧡
Always sincerely with You😊
Your Rocket Bomb🚀💣

$NEOUSD - Breakout from the triangleHi guys! 👋🏻
🔔 NEO USD made a breakout from the triangle and is following a parallel channel for now.
🔔 Neo will eventually close above the upper threshold of the ascending channel and continue upwards, the impulse is great, MACD looks bullish, great support by EMA50 and the N3 of NEO sounds promising.
✊🏻 Good luck with your trades! ✊🏻
If you like the idea hit the 👍🏻 button, follow me for more ideas.

$NEOUSD is still early on a Wave 5 leg up! Let's go!NOT FINANCIAL ADVICE.
In this elliot wave analysis, $NEOUSD looks to be on a Wave 5 underway with a TP of $91.65 highs from its Mar 2020 lows.
With NEO Blockchain 3.0 genesis block around the corner, there is good momentum for this token.

NEO on way further into increase trend!Hello trading friends,
NEO looks on good way to increase further to target.
Our before update for NEO Here below

