Neousd


NEO/USD Multi-Timeframe analysis Hello Traders, here is the full analysis for this pair, let me know in the comment section below if you have any questions, the entry will be taken only if all rules of the strategies will be satisfied. I suggest you keep this pair on your watchlist and see if the rules of your strategy are satisfied.


NEO - Big Pump is coming!Hi,
We know all that NEO follows Ethereum (obvious as it's the Chinese Ethereum ) and we can notice that there is still a delay between a pump from Ethereum and that of Neo.
My analysis makes it clear that we are done about the second wave (orange color). It means we'll get shortly a strong impulsive wave .
I expect to see again a Neo to 90$.
It's a long for me!
Trade safe and not with your emotions...!
Cheers,
PS: it's not a Financial Advice.

NEO/USDT 4 HOUR CHART PARABOLIC MOVEMENT INCOMINGNeo is throwing the same fractal that Btc did prior to going parabolic. If you agree throw me a like and follow me for more unique concepts and ideas that keep you in the gains.

✳️NEO/USDT Analysis (26/11) View + Trading Plan #NEO $NEONEO has been turned down in the 21-22$ zone and NEO is heading to the 15-16$ zone. This is a good place to buy for a strong bull run later this year.
The 21-22$ zone is currently the most important resistance NEO needs to cross in order to continue its uptrend
📈BUY- LONG
-Buy: 15-16$, SL if B
-Buy more: 21-22$ if A, SL if B
📉SELL-SHORT
-Sell: 33-34$, SL if A
♻️BACK-UP
-Sell: 15-16$ if B, SL if A
-Buy: 10-10.5$, SL if B
❓Details
Condition A : "If 1D candle closes ABOVE this zone"
Condition B : "If 1D candle closes BELOW this zone"

NEOUSDNEO looks like a very attractive Buy in a mid-term horizon.
Waiting for the breakout and retest before long confirmation.

NEO/USDT in Falling Wedge!!Hi every one
NEO / TETHERUS
The Falling wedge is broken and the price can go up.
Traders, if you liked this idea or have your opinion on it, write in the comments, We will be glad.
Things can change...
The markets are always changing and even with all these signals, the market changes tend to be strong and fast
Thank you for seeing idea .
Have a nice day and Good luck.

NEOUSD | This bullish reversal move can trigger a bigger rallyHey friend, hope you are well and welcome to new update on NEW coin.
Lauch of NEO 3.0 Mainnet:
This is the month when the NEO 3.0 Mainnet launch is expected it can be on 31th Dec or earlier.
The market cap is increased significantly, and if we take a look at the priceline then it is already up by more than 500% from the month of March.
Previous Shark move:
In the month of April I shared an idea that produced more than 500% rally.
Previous BAT move:
After that the price action formed another BAT pattern, that I shared with you in Jun 2020, and this idea produced more than 171% rally.
Current bullish reversal move:
Now again the priceline ha formed another bullish reversal move. This time we also have a mainnet launch news at the support of this bullish reversal pattern, therefore, it may trigger a bigger rally.
Strong supports of moving averages:
On the long term weekly chart the price action is having good supports of exponential moving averages 10 and 21 and simple moving average 25 as well.
Conclusion:
Even though the charts and the overall situation is very positive in favor of bullish move, but we should use 25 SMA on weekly chart as stop loss because, if it will be broken down then price line may turn more bearish to complete harmonic move on long term.

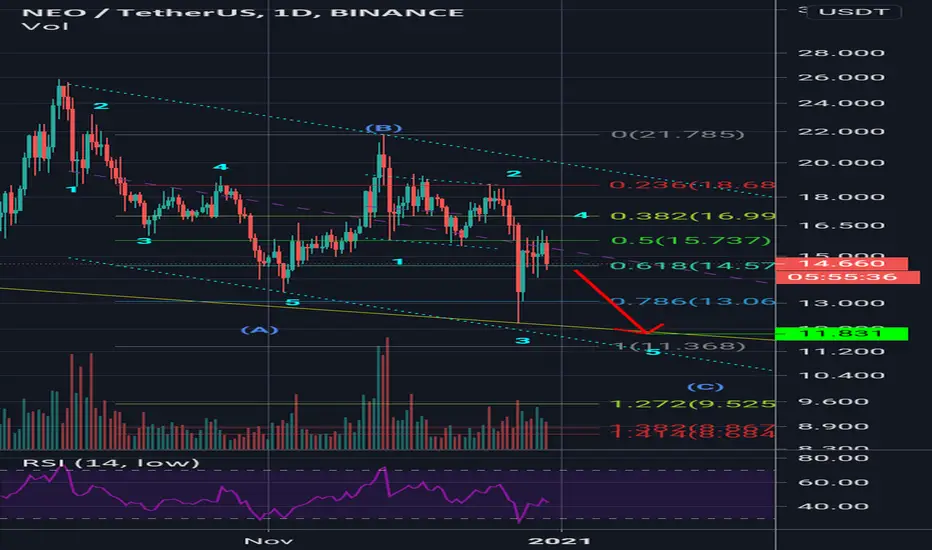
NEOUSD has formed Gartley | Upto 33.8% rally expectedThe previous idea of NEO produced more than 177% rally.
Now again on daily chart , the price action of NEO coin has formed Gartley pattern and reached in potential reversal zone.
Buying And Sell Targets:
The buying and sell targets as per Fibonacci sequence of Gartley pattern should be:
Potential reversal or buying zone: $ 16.67 to $ 15.26
Fibonacci projection or sell zone: $ 17.77 to $ 20.42
Stop Loss:
The potential reversal zone area that is up to $ 15.26 can be used as stop loss in case of complete candlestick closes below this level.
Possible profit and loss ratio:
As per above targets this trade has a profit possibility of 33.8% and as per the above-mentioned stop loss, the loss possibility is 8.5%.
Note: Above idea is for educational purpose only. It is advised to diversify and strictly follow the stop loss, and don't get stuck with trade.


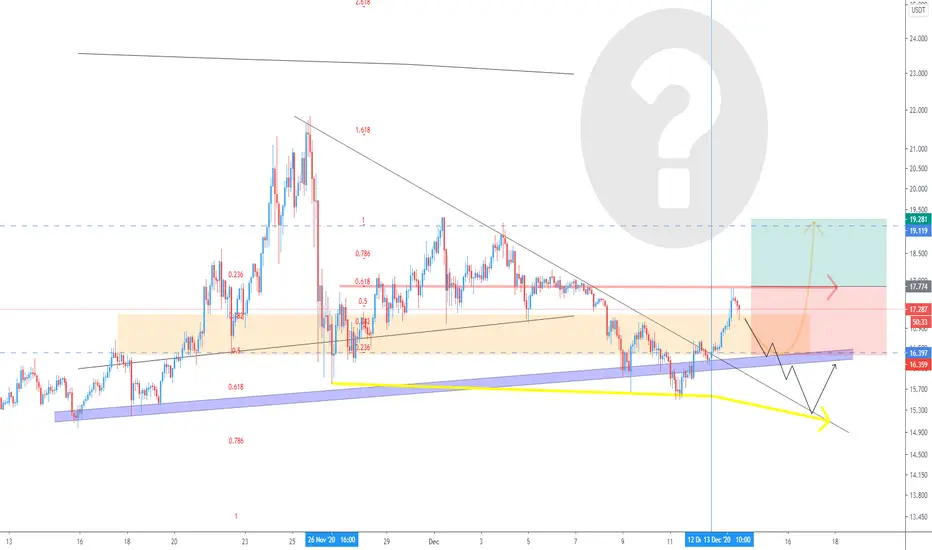
NEO entry point
NEO has spent Q3 consolidating around $17 while creating a potential bullish December setup.
The price is currently consolidating above a key monthly level and under the December open - a scenario that can often precede a bullish month. Multiple EMAs have also created a bullish crossover during the last two weeks, possibly setting the stage for a new trend.
Relatively equal highs near $19.32 provide a first target for any intra-week pumps. The second series of relatively equal highs near $21.829, along with a third target at the $25.859 swing high, provide reasonable targets if a bullish trend kicks off.

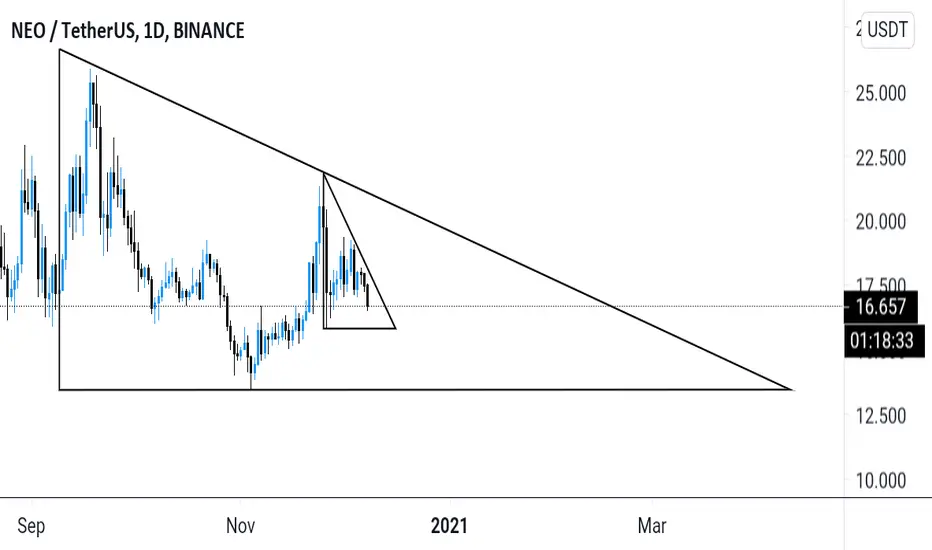
NEOUSDT - Descending triangle NEOUSDT is printing a descending triangle pattern on a daily timeframe.
Looking at NEO - Keanu Reeves! NEOBTCAlligator can be seen to be 'waking up' indicative of a bullish move.
Broken out from a fallen wedge.
Strong double bottom.
BTC pair.

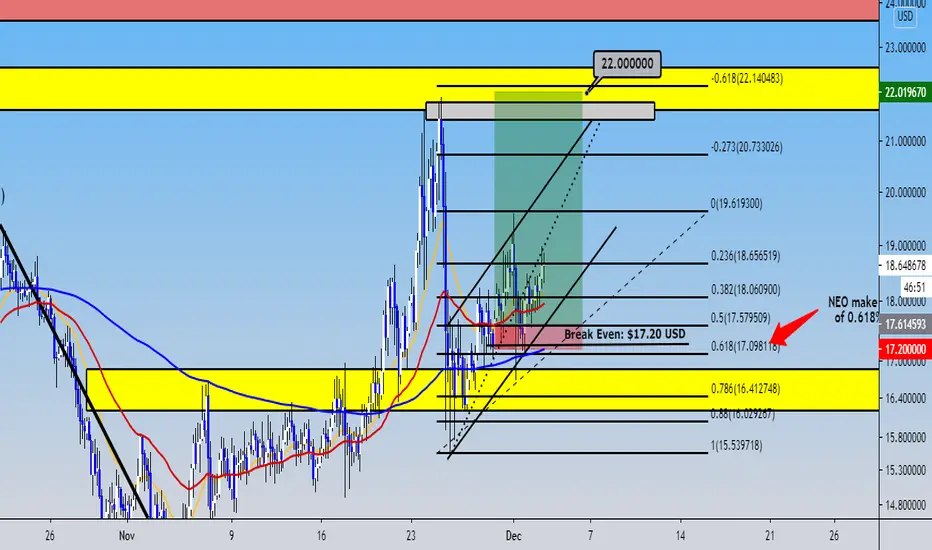
NEO still bullish in this channel up!!! Daily key analysisNEO show in H4 timeframe a good bougth past in the past days in the 0.618% of Fibonacci, So, I entry around of the 0.50% of Fibonacci when I show you this long signal and then, I'm in profit from $17.60 USD. Also, I invite you to put a break even at $17.20 USD to protect your earnings and loss relation.
Now, NEO in Daily it's bullish to $22 USD.
And this it's a strategy that I draw an entry of 0.618% of Fibonacci using an model of the price action. So guys, for that reason this is the model of what the bullish signal of NEO make.
NEO continue up!!! Be patient!!!I add a message that when I see in my Quantfury App, this position don't touch the SL for 0.09 cents of distance. Jaja, that it's crazy!!!
But so, we have that NEO make a rejection so fastest!!!
But, looking in the chart of 3 Daily, we see that NEO have potential to continue up in the next days. For that reason, I continue in this position.
In Daily, we see that NEO continue up and maybe I will need how NEO closed today!!!

NEOUSD 4D: SWING: Accumulation BUT maxed out for now (SL/TP)(NEWWhy get subbed to to me on Tradingview?
-TOP author on TradingView
-15+ years experience in markets
-Professional chart break downs
-Premium content
-not just random lines on the chart
-Supply/Demand Zones
-TD9 counts / combo review
-Key S/R levels
-No junk on my charts
-Frequent updates
-Covering FX/crypto/US stocks
-24/7 uptime so constant updates
NEOUSD 4D: SWING: Accumulation BUT maxed out for now (SL/TP)(NEW)
IMPORTANT NOTE: speculative setup. do your own
due dill. use STOP LOSS. don't overleverage.
🔸 Summary and potential trade setup
::: NEOUSD week/candle chart review/outlook
::: long-term accumulation in progress
::: BUT topped out for this cycle already
::: expecting 40-50% correction next few months
::: to complete the sequence
::: before it can finall breakout of the range
::: correction is REQUIRED
::: later we can pump 300%+ from that base
::: but that's not until 2021
::: no upside in 2020 so just SHORT IT
::: recommended strategy: SHORT SELL any rips/rallies
::: TP BEARS on the swing is 40-60% gains
::: SHORT/HOLD setup / swing tarde
::: for patient traders only / no fast gains here
::: only use low leverage don't do gambling here
::: the sequence for the BEARS
::: Just short high and you will get paid, period
::: good luck traders
🔸 Supply/Demand Zones
::: N/A
::: N/A
🔸 Other noteworthy technicals/fundies
::: TD9 /Combo update: N/A
::: Sentiment mid-term: BEARS/SWING/40% GAINS
::: Sentiment outlook short-term: BEARS/CORRECTION
