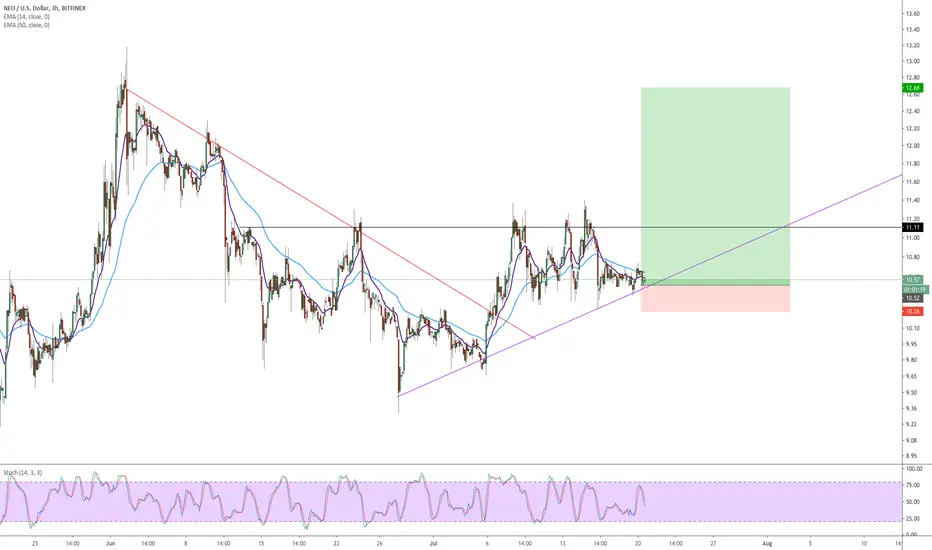
NEO / USDT First Sell Zone, correction and FLY!NEO came to first sell zone, all levels to buy (green) and purple (sell) is actual.
Be careful near dynamic resistance.
Good luck!
Neousd

Near Trend Started On Neo, Going to correct itself then go upNEOUSDT Analysis
A few hours back crossover of Kijun (Red Line) and Tenken (Blue Line) which gave us a weak sell signal because the price was above the KUMO cloud and then price went into the KUMO cloud which means it is consolidating and another sign was shown when the crossover of cloud happened which has started Red cloud that also means the price is going down. There will be a Strong sell signal if price closes below the KUMO cloud and other signs are not reversed.
The main trendlines that I have plotted in this secondary trend are around 12.250 which is resistance and around 10.78 which is support. There is also one internal trendline that I plotted before which was support now price has penetrated support and support became the resistance. It will have to cross this internal resistance in order to go upward. There are also other resistances like the border of cloud and Redline.
I initiated a short position when price struck my resistance and now the target is major trendline support of the secondary trend which is around 10.8.

Neo Path to $16 - LONGThis is what I see happening.
Like this and drop a follow if this plays through.
thanks for checking it out.


🎯 In My Dm's Asking for a Request? Here you go! | NEOUSDTBias:
🔞 This is a requested chart done for one of my supporters and simply highlights this current price action structure and how this could continue from this support range up to what is the next nearest resistance ranges to keep in mind. On the flip side if we head down much lower seeing anything lower than S2 would be very detrimental to the current bullish market structure. Stay safe with Alts during this massive Bitcoin volatility.
Hit that 👍 button to show support for the content!
Help the community grow by giving us a follow 🐣
-----
1h Support:
S1: This clustering contains two Orderblocks left from the pump that brought us out of that $10 range. This also has one S/R flip which as it would appear has acted as a point of significance assuming this move does find its short term bottom here.
S2: This clustering has two expected S/R flips that are expected to act as a range of significance if we pull back.
1h Resistance:
R1: This range consists of the current S/R flip that we pulled back from, regardless of the next move if we have a move up from here this level is likely to see some kind of reaction to it.
R2: While this range is not Highlighted by Alpha mapping or Directional Bias, we can't win them all, and such I had to manually plot it. Anyways this range may see a reaction if the price is not able to achieve the R3 range in one fell swoop.
R3: This being the most recent significant swing high ensures a reaction here with continued upside price action. To be kept in mind even if you expect a move higher than this level.
-----
Here are some significant levels of interest on a higher timeframe to at least keep in mind going forward. Anything lower than S2 is a clear bearish signal and should be considered heavily if currently long if and when that occurs.
✨ Drop a comment asking for an update, we do NEW setups every day! ✨

NEO/USD: Multiple Levels of AnalysisNEO/USD was requested by my good friend GBU Professor Wally. I apologize I was not quick enough to respond to his Super Chat on Friday afternoon.
I quite like NEO in this area. On the Weekly Timeframe, we are consolidating following a downtrend and now a long period of sideways and volatile ranging. I identify the current formation as a Rectangle Bottom, which I have a high hit rate with in my discretionary trading. Once our weekly resistance level is broken (weekly close above) it will also flip the weekly SuperTrend bullish. I have marked out our measured weekly profit targets.
On the Daily, we are receiving a potential PTP Daily Swing Long Signal. The actual signal would have been generated on yesterday's candle, however we were above the Qualifying Line generated by our Donchian Base Line. Now we have a potential RBB buy in opportunity and price is within our Buy Zone. Good R/R on this setup.
On the hourly, we can see a potential market bottom being signaled. ICYS Bot has generated a buy signal in addition to Vix Fix signaling a high volume potential bottom.
Trade safely and position size wisely, 2% risk is recommended.

NEO AnalysisRSI and other indicators looking healthier. RSI showing bullish IH&S cycle and bullish divergence in HTF chart.

Is neo broken the long term downtrend line?Hello, traders.
Is neo broken the long term downtrend line? We don't know yet, but the asset is an interesting forming accumulation pattern in long-term resistance. If we break up, the downward trend of this asset can change, so we must pay close attention to the NEOBTC
Push the like button and follow us on TradingView.
Sandro and Gustavo.

NEOUSD D1: upside limited 20%+ correction UP NEXT(NEW)Why get subbed to to me on Tradingview?
-TOP author on TradingView
-15+ years experience in markets
-Professional chart break downs
-Supply/Demand Zones
-TD9 counts / combo review
-Key S/R levels
-No junk on my charts
-Frequent updates
-Covering FX/crypto/US stocks
-24/7 uptime so constant updates
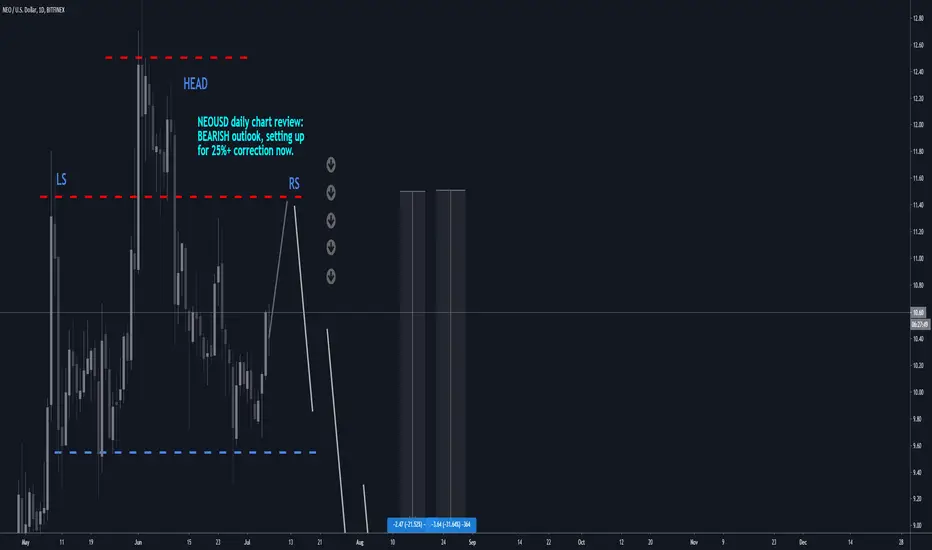
NEOUSD D1: upside limited 20%+ correction UP NEXT(NEW)
IMPORTANT NOTE: speculative setup. do your own
due dill. use STOP LOSS. don't overleverage.
🔸 Summary and potential trade setup
::: NEOUSD daily chart review and outlook
::: not a trade setup / warning only
::: speculative H&S setup / BEARS
::: limited upside from here
::: RS /LS symmetry at 11.45
::: strategy: STAY OUT / SHORT IT
::: nice symmetry and likely leads to correction
::: up to 20%/25% losses next 4-6 weeks
::: so recommend to stay out of this market
::: good luck traders
🔸 Supply/Demand Zones
::: supply/demand: N/A
🔸 Other noteworthy technicals/fundies
::: TD9 /Combo update: N/A
::: Sentiment short-term: BULLS
::: Sentiment outlook mid-term: BEARISH

NEO.BTC (Y20.P3.E1).Compression for a breakoutHi All,
NEO macro chart shows a compression formation ready to break out to the upside, very similar to ETH.BTC.
How to trade this?
Maybe wait for it to break the main trend line resistance and\or the fib. level 0.382 level, before jumping in.
4 HRLY chart
Please give a tick or like for this post.
Cheers,
S.Sari


NEOUSD long idea, NEOUSD alis fikriWe see NEO as it is forming up the 5th wave up.
NEO nun 5. dalgasina hazirlandigini goruyoruz.

EW Analysis: NEOUSD Can See A Deeper Corrective DeclineHello traders!
Today we will talk about cryptocurrencies, specifically NEO and its price action from Elliott Wave perspective.
NEOUSD made an impulsive five-wave cycle from March lows, which suggests a bullish reversal at least in three waves A/1 - B/2 - C/3. Since the beginning of June, seems like NEO is making a three-wave a-b-c correction, where wave "c" is still missing. So, don't be surprised if we see another decline towards projected 8.0 - 6.0 support zone around important 61,8% - 78,6% Fibonacci retracement and this is where a higher degree wave B/2 correction may come to an end, which can be followed by strong and impulsive bounce back to highs for wave C/3. In case if we see something deeper and more complex, invalidation level remains at 4.0!
Be humble and trade smart!
If you like what we do, then please like and share!
Disclosure: Please be informed that information we provide is NOT a trading recommendation or investment advice. All of our work is for educational purposes only.

Don't miss the great buy opportunity in NEOUSDTrading suggestion:
. There is a possibility of temporary retracement to suggested support line (9.59874). if so, traders can set orders based on Price Action and expect to reach short-term targets.
Technical analysis:
. NEOUSD is in a range bound and the beginning of uptrend is expected.
. The price is above the 21-Day WEMA which acts as a dynamic support.
. The RSI is at 52.
Take Profits:
TP1= @ 12.55810
TP2= @ 14.50133
TP3= @ 16.87258
TP4= @ 20.61120
TP5= @ 24.30101
SL= Break below S2
❤️ If you find this helpful and want more FREE forecasts in TradingView
. . . . . Please show your support back,
. . . . . . . . Hit the 👍 LIKE button,
. . . . . . . . . . . Drop some feedback below in the comment!
❤️ Your Support is very much 🙏 appreciated! ❤️
💎 Want us to help you become a better Forex trader ?
Now, It's your turn !
Be sure to leave a comment let us know how do you see this opportunity and forecast.
Trade well, ❤️
ForecastCity English Support Team ❤️


NEOUSD D1: 25% correction UP NEXT / don't get caught up(NEW)Why get subbed to to me on Tradingview?
-TOP author on TradingView
-15+ years experience in markets
-Professional chart break downs
-Supply/Demand Zones
-TD9 counts / combo review
-Key S/R levels
-No junk on my charts
-Frequent updates
-Covering FX/crypto/US stocks
-24/7 uptime so constant updates
NEOUSD D1: 25% correction UP NEXT / don't get caught up(NEW)
IMPORTANT NOTE: speculative setup. do your own
due dill. use STOP LOSS. don't overleverage.
🔸 Summary and potential trade setup
::: NEOUSD 2D chart review and outlook
::: not a trade setup / warning only
::: speculative H&S setup / BEARS
::: limited upside from here
::: RS/LS symmetry at 11.45
::: strategy: STAY OUT / SHORT IT
::: nice symmetry and likely leads to correction
::: up to 25% losses next 4-6 weeks
::: so recommend to stay out of this market
::: good luck traders
🔸 Supply/Demand Zones
::: supply/demand: N/A
🔸 Other noteworthy technicals/fundies
::: TD9/Combo update: N/A
::: Sentiment short-term: BULLS
::: Sentiment outlook mid-term: BEARISH

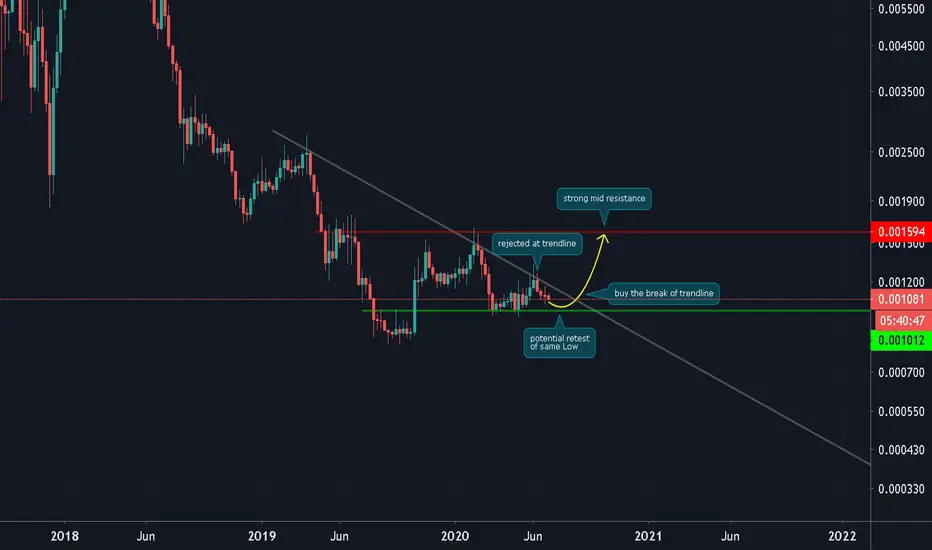
NEO/BTC (Retest Previous Weekly Support)NEO/BTC
-rejected at the downward trendline
-will likely retest the previous support at 1000 sat
-if that support will hold it will be a good buy zone
-you can also buy the break of the trendline
-the upside potential is up to 1600 sats
Keanu NEO Looks good setting up for a nice buy above the descending broadening wedge
3rd test above the wedge
