NEOUSD 4D: Potential bullish setup 100% gains (SL/TP)(NEW)Why get subbed to to me on Tradingview?
-TOP author on TradingView
-15+ years experience in markets
-Professional chart break downs
-Supply/Demand Zones
-TD9 counts / combo review
-Key S/R levels
-No junk on my charts
-Frequent updates
-Covering FX/crypto/US stocks
-24/7 uptime so constant updates
NEOUSD 4D: Potential bullish setup 100% gains (SL/TP)(NEW)
IMPORTANT NOTE: speculative setup. do your own
due dill. use STOP LOSS. don't overleverage.
Tagged as SHORT because I expect more short-term
losses before reversal (BULLS).
🔸 Summary and potential trade setup
::: NEOUSD 4daily chart review
::: Speculative bullish setup
::: more losses short-term
::: 8.00/8.20 reload point bulls
::: 100% gains possible from my level
::: strategy: BUY LOW 8.20
::: TP bulls is +100% gains BUY/HOLD setup
::: buy low near my level and get rewarded
::: TP bulls is 16.00/18.00
::: but reversal soon after from my level
::: good luck traders
🔸 Supply/Demand Zones
::: dem/supp N/A
🔸 Other noteworthy technicals/fundies
::: TD9/Combo update: N/A
::: Sentiment short-term: BEARS
::: Sentiment outlook mid-term: BULLISH
Neousd

NEOUSD: Analysis using Ichimoku 30/06/2020H4
On D1, the cloud is directing downward, indicating a downtrend.
Conclusion:
Locally, we recommend selling when the RSI reaches an overbought on H4.
H1
At H4, the cloud is directing upward, indicating an uptrend. At H1, the cloud is directing upward, indicating the movement within the framework of the trend for H4.
Conclusion:
Locally, we recommend buying when the RSI reaches an oversold level at the local price correction.

NEOUSD | A Possible Bullish ReversalHi friends hope you are doing well and welcome to the new update on Neo coin. As the Neo coin has broken down the support of an up channel that was formed on the daily chart same as like the Bitcoin has broken down the channel. In today’s post we will try to understand now what can be happen next whether the price action will move up or move down.
Breaking down the channel and a golden cross:
As we have already discussed that the priceline of Neo coin has broken down the support of the channel. The formation of this channel was started after the mid of March 2020. On 7th June a golden cross between 50 simple moving average and 200 SMA.
This golden cross produced a powerful rally that leaded the price action up to the resistance of the channel. However after making a powerful attempt to break out the resistance the priceline moved back to hit the support of the channel and finally it has broken it down. At this time the price action is breaking down the 50 simple moving average once this moving average will be broken down then Neo can hit the 200 SMA. The golden cross formation is below the price action therefore unless this golden cross will be not changed to the death cross there will be a hope for the bullish reversal of price action.
Support and resistance levels:
Now if you watch the different support and resistance levels on 2 day chart then it can be observed that after mid of march the price action turned bullish and produced more than 125% rally. And reached at $13 resistance. That is really very strong resistance as it is not broken out since after July 2019. Once the price action broke out this level. But while retesting this resistance as support it was failed. At that time all the markets were moving down. And the Neo coin also moved down with other markets as well. After hitting the last support at $6 it produced more than 125% rally and after breaking out every resistance level it has been retesting the every resistance as support. At this time after hitting the $13 resistance and being rejected it is again dropped at $10 support. If the price action will be not able to retain this support then it can move to the next support at $8.
Formation of bullish reversal pattern:
Even though the price action has broken down the support of up channel on the daily chart. But at the same time the Neo coin has formed a bullish reversal pattern and that is harmonic BAT. The price action has just spiked into the potential reversal zone. This PRZ starts from $10 up to $9.65. Now we can set our stop loss the maximum extent of this bullish BAT pattern’s PRZ level. Because if the potential reversal zone will be broken down then the priceline move more down to form a bullish Crab’s final leg.
Ichimoku cloud:
Now at the end of this article I would like to share a very important move of Neo coin that can be appeared in the near future. And that is the ichimoku cloud on the long-term weekly chart. As we can observe that the Neo coin never able to cross up this cloud and now it is continuously making several attempts to break out this cloud. After making the recent attempt it is moving down but we have still lagging span of the ichimoku cloud above the price action that is a bullish signal. And the conversion line is crossing up the baseline just below the price action. That is another bullish signal. Now if the price action will take a powerful bullish divergence from the potential reversal zone of BAT pattern that is formed on the daily chart. Then it might be helpful for the priceline to break out this cloud and once this cloud will be broken out then it will become a very strong support for the long term bullish rally.
Conclusion:
On weekly chart after hitting the ichimoku cloud the price action is moving down. And it has also broken down the up channel. And it has also formed a bullish reversal pattern. Therefore the unless the potential reversal zone of this BAT pattern will not be broken down we can hope for a powerful bullish reversal from here.

NEOUSD: Analysis using Ichimoku 19/06/2020H4
At D1, the Ichimoku cloud is directing upward, indicating an uptrend. On H4, the cloud is directing downward, indicating the formation of a correction for D1.
Conclusion:
We recommend buying when the RSI reaches an oversold level on the H4 and selling when the RSI reaches the overbought.
H1
At H4, the cloud is directing downward, indicating a downtrend. At H1, the cloud is directing downward, indicating the movement within the framework of the trend for H4.
Conclusion:
We recommend buying because the price went beyond the downtrend at H4, while the RSI on the H1 has reached the level of oversold.
We also recommend selling when the RSI reaches the overbought level on the H1 and H4.
Good luck!

On #NEO, as on #XLM, the move down from the top is a very cleanGiven the slope, it doesn't seem to be wave C of a flat -> more downside in perspective

NEO-USD LONG TRADE SETUPPlease manage your risk. Use Stop loss. And do not take blind entries.
If you have question let me know. If you want to analyze any pair let me know.
This is just an idea. What we see.
Market can go in the opposite direction, what we analyze. so we have to manage our risk and adopt the situation accordingly.

NEOUSDHello, On the NEOUSD weekly chart - NEOUSD is close to a T.K cross. On the previous T.K cross, NEOUSD expanded over 100%. This could see NEOUSD, rise further, over the coming weeks. Not advice.


NEO: Analysis using Ichimoku 06/06/2020H4
A rising channel is visually recognized, the borders of which the price is currently testing.
The NEO price is trading on the Ichimoku cloud, indicating the presence of a local correction.
RSI is directed towards to level of oversold.
Conclusion:
We recommend buying from a key support level of Fibonacci 50%.
H1
The price is trading below the Ichimoku cloud, indicating the zone of the possible completion of the correction.
RSI is overbought, indicating sellers are weak.
Conclusion:
We recommend buying from a key support level of Fibonacci 50%.
Good luck!

NEOUSD | A Possible Move To $200Hi friends hope you are doing good and welcome to the new update on Neo coin. In today's article will see how the Neo coin has turned bullish after the formation of very big bullish harmonic pattern. And now what next and how the price action will behave.
Big bullish Shark pattern has done its job:
In my previous article on NEO that I published on April 2020. I revealed that the price action of Neo coin has formed a very big bullish Shark pattern on two week chart. And the final leg of this pattern was completed in the month of March when the Neo and all other cryptocurrencies even the complete market was facing very strong bearish trend. And this strong bearish rally helped the Neo coin to complete this final leg. And as per Fibonacci sequence of bullish Shark pattern I predicted that because the price action has entered in the Fibonacci retracement 0.886 to 1.13 Fib level. Therefore now the Neo coin will turn bullish from here and it will be entered in the Fibonacci projection of C to D leg from 0.382 to 0.786 Fibonacci projection. And as per prediction that I made on the basis of the Fibonacci sequence of this pattern the price action finally turned bullish and so far it has produced more than 130% bullish rally.
SMAs are showing bullish move that can breakout the channel:
After starting the bullish move the price action of Neo coin has formed an up channel on the daily chart. And during the movement in this channel we have seen two major attempts by the price action to break out the channel. 1st attempt was made in the second week of May and second attempt was started from the 1st June and even at this time price action is trying to breakout the resistance of the channel. And if we watch the simple moving averages with the time period of 50 and 200 on the same daily chart then we have a very positive move by these moving averages as 50 simple moving average is moving up to form a golden cross with 200 SMA. If this golden cross will be formed then the price action will have a strong support of these two simple moving averages. And this cross can produce more powerful rally that can help the priceline to breakout the resistance of this up channel.
Wedge formation and bullish signals by exponential moving averages and Bollinger bands:
Now let's switch to the weekly long-term chart. And here it can be easily observed that the price action of Neo has formed very big wege pattern on this weekly char. The formation of this pattern was started from November 2019 and sincethen the price action is not able to break out from this pattern. And this time the price action has again geared up and reached at resistance of the channel to break out. This time we have two major positive signals for the breakout. 1st signal is the bollinger bands is moved above the resistance of this wedge. Therefore this time the priceline will not face the resistance of the bollinger bands as it has been facing previously while making the previous attempts for the breakout from this wedge. And the second positive signal is that a bull cross is formed between the exponential moving averages with the time period of 10 and 21 just beneath the priceline. That can be also very helpful for NEO to breakout from the resistance of the wedge. However if we watch the volume profile of the complete priceline moving within this pattern. Then we have the trader’s interest upto the support and while moving upward the volume profile is showing that trader’s interest is upto $11.5. And at this time the price action is at the area where the trader’s interest is weak, however the support of exponential moving averages and the position of the bollinger bands can help the priceline to break out from the resistance of this wedge.
Ichimoku cloud:
Now I would like to draw your attentions towards a very important indicator and that is Ichimoku cloud. And on the chart it can be easily seen that the price action never able to break out from this cloud on the weekly chart. From June 2019 we have witnessed several attempts by the priceline to hit this cloud but so far all attempts are unsuccessful. At the moment the cloud is very weak and the price action has hit the cloud again for another try to cross up. At this time the resistance of the cloud is at $13 where the price action has already spiked. If we watch the lagging span of the cloud then it is turned bullish and it has crossed up the candlesticks. And the conversion line is moving up to cross the baseline once this cross will be completely formed then we can see the cloud will be turned bullish (green color). And the candlesticks can cross up this is bullish cloud very easily. Once this cloud will be broken out then it will become a very strong support for the NEO coin that will lead to a very long term strong bullish rally.
Let’s talk about the key level resistance:
Now If talk about the different long term resistance levels for the Neo coin. Then Neo has very strong resistance at $13. This resistance has not been broken out since after December 2018. Once it was broken out in June 2019 but while re-testing this resistance as support the price action failed to retain its position above this level. After bullish move that has been started after the mid of March 2020. Finally the price action has again reached at this resistance level and if this $13 resistance will be broken out then we will have the next level resistance at $20 that is a key level resistance for NEO. Once this key level resistance will be broken out then it will be easy for the price line to reach up to the previous highest price ever in the history that is around $200 as on the long term the priceline of Neo has no significant resistance between $20 up to 200 dollars.
Conclusion:
At this time it is important for the priceline of NEO to cross up $13 level. As at the same time $13 is the resistance of an up channel and the wedge and ichimoku cloud as well. Once this resistance will be broken out then price action can reach next key level resistance at $20 within no time. And once the $20 will be broken out then on long-term it can reach upto $2 level very soon.
Note: This idea is education purpose only and not intended to be investment advice, please seek a duly licensed professional and do you own research before any investment.

NEO Coin Formed Very Big Shark Pattern And Ready For Big MoveBig wedge:
On weekly chart priceline of Neo coin has formed a wedge and the support of this wedge is at 5.46 dollar. This is really very strong support that is not broken since December 2018. During the recent strong bearish move in the month of March 2020 we have seen that the price action has hit the spike upto $4 but could not break down the support. After placing the volume profile on the complete price action of this wedge as a result we can see that the traders interest is really very low below $6.8 and above $11.70. And the pint of control of volume profile is at $9.30. Therefore when the priceline moved in the area where the traders interest was weak it turned bullish and moved back into the zone where the traders are interested to trade.
Oscillators and indicators:
After hitting the support of this wedge the stochastic oscillator has given bull cross from the oversold zone and the moving average convergence divergence the MACD indicator was strong bearish but now it is turning bullish and if we see the directional movement then it can be exmaniced that the directional indicator 1+ is moving up to form a bull cross with the directional indicator 1- . Once this bull cross will be formed then the price action can turn more bullish to make an attempt to breakout the resistance of this wedge.
Ichimoku cloud:
If we see the ichimoku cloud on weekly chart then it can be observed that the bearish cloud is turned very weak at this time. Therefore it will be easy for the priceline to cross up the cloud. And once the pric line of Neo coin will be able to cross of the bearish cloud then it will be really a very big success for the Neo coin because the Neo coin could not cross up the bearish cloud on weekly chart since it is appeared in the history of this asset. The lagging span has entered in the priceline and once it will cross up the candlesticks then it will be another very strong bullish signal. The conversion line has touched the baseline and soon it will also form a complete bull cross then there will be strong chancess that the cloud will be turned bullish and the price action will cross up the ichimoku cloud. And after crossing up the cloud Neo coin can start a really very powerful bullish rally.
Very big bullish Shark pattern:
Now if we switch to the 2 week chart then it can be easily witness that the price range of NEO coin has completed a bullish shark harmonic patter. And after the completion of this pattern now the price range is moving in the potential reversal zone of this big bullish harmonic pattern. Potential reversal zone is also a buying area and the maximum extent of this potential reversal zone should be used as a stop loss. Now there are strong expectations that as per Fibonacci sequence of the priceline should move up from this area and enter in the Fibonacci projection of C to D leg from 0.382 to 0.786 Fibonacci projection.
The buying and sell zones start and end as below:
Buy between: $7.49 to $5.84
Sell between: $9.73 to $13.81
But if the price line will breakout the $13.81 barrier then it can turn really very strong bullish coz in that case it will also breakout the wedge resistance.
Final thoughts:
At this time all signals are turning bullish but soon they will be turned strong bullish because the Neo coin is already getting bounced from the support of wedge. But we should be careful about the stop loss and the support of the wedge or the potential reversal zone of Shark pattern should be used for this purpose.

NEO/USD : stay above $9-10 looks good! Neo could be breaking out if it can hold above $9-10 ; if it fails to hold a nd break out; could see lower prices as bearish price action

NEO BULL BULL BULL NEO is bullish
Ready to test that trendline and a possible break is coming
Bullish momentum in alts + big announcement incoming

Neutral on NEO, until... hi @shayyaaneshan, here's the NEO analysis that you requested.
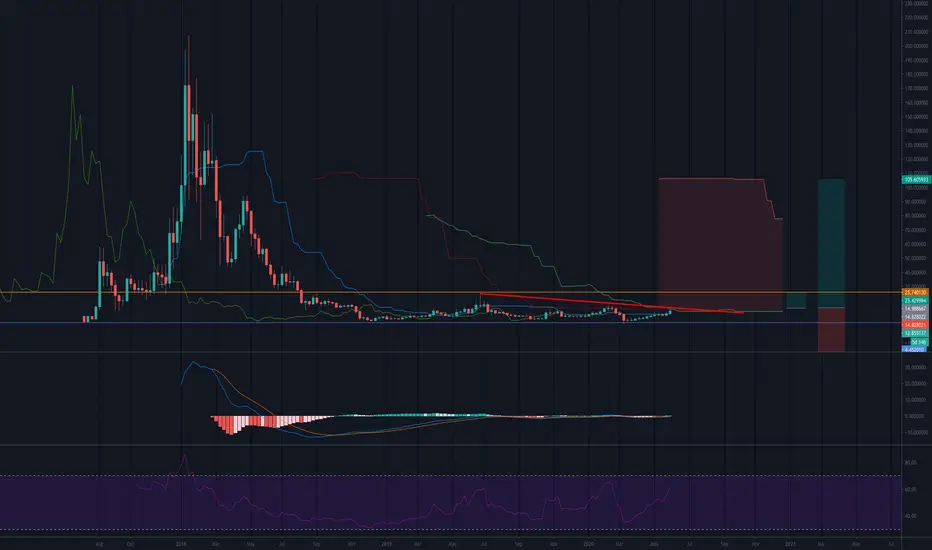
NEOUSD has been stuck in a range for 2 years. From $5 to $25. Good news is that current price is testing the downwards trendline and also pushing against the weekly ichimoku cloud (using crypto settings). A rise from current price of about $13 to a closing weekly price of about $15 (or higher) suggests a test of the trading range ($25) and possible continuation all the way up the cloud to $100, a 600% gain.
The rise from $15 to $25 seems totally reasonable based on the technicals. We'd have to re-evaluate the chart once it reaches there to assess the breakout to that higher target of $100.
MACD and RSI both point up.
But until price closes inside the cloud above the downtrend resistance, it could just as easily get pushed down again from current price by bouncing off the bottom of the cloud and getting rejected once again by that downtrend.
Until NEOUSD breaks above downtrend resistance and cloud, we're Neutral.
NEO/BTC (Bullish Daily Candle Break?)NEO/BTC
-a bullish break above 200D MA
-new daily higher high
-if we can close above 1240
-this will give Long signal priority
-upside target is the swing top at 1626
-stoploss below 200D MA

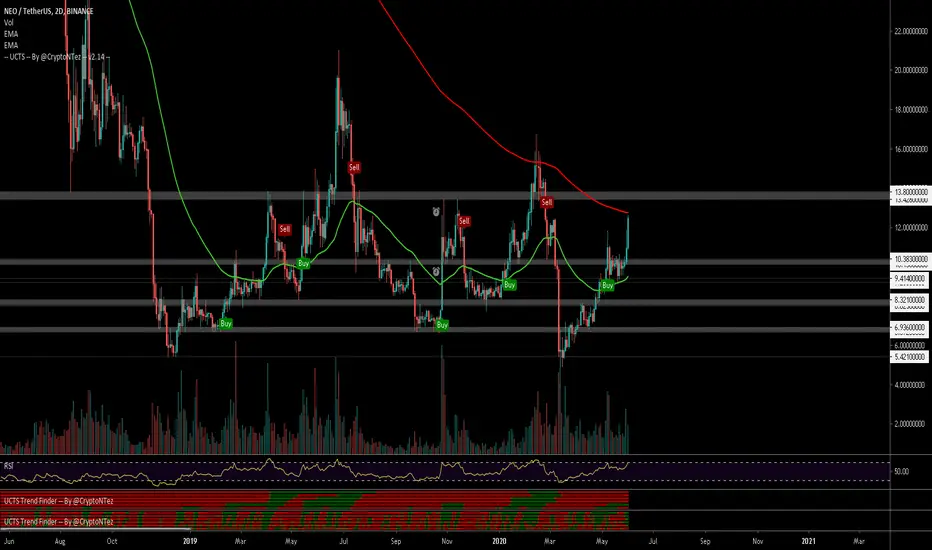
$NEO, Nice continuation over ~10$ support level... $NEO / #USD
Nice continuation over ~10$ support level...
Volume rising as UCTS indicator is showing buy signals across multiple levels..
EMA50/200 golden cross on the daily
~14$/ #NEO soon

Will Morpheus Give NEO the Green or Red Pill? 💊 | NEO ($NEO)😎 With a major health tracking project and the Neo3 upgrade on the way, the news is decent enough for the "Chinese Ethereum" AKA NEO. Meanwhile, with the general strength in crypto as a whole, NEO has plenty of room to run if it can keep up momentum. With that said, we don't have any clear setup here, so let's simply take a look at some key levels for the bulls, bears, and undecided to watch as price action plays out.
Resistance:
R1 is the range high plus a bearish orderblock and is the first point of resistance to contend with here. The R2 bearish orderblock was formed back from the drop in March and also contains the dead cat bounce failed swing high. Lastly and most importantly, the R3 bearish S/R flip and orderblock cluster is a minor price pivot point that will almost certainly see a reaction if and when price gets there.
Support:
To the downside we have S1 support which is a major price pivot point consisting of various order blocks and S/R flips throughout the chart. Meanwhile, we have the S2 bullish orderblock as a backup support if S1 doesn't hold. While there are multiple other orderblocks and S/R flips lower from S1 we feel that the price is likely to loss its uptrend and such we don't wanna call any knife catching levels as we only trade trend continuation.
Outlook:
A logical path for price is what we have marked as bullish continuation, where we move up along the upper trend line reacting to key levels along the way. Note here that we feel the trend line is valid as price frequently reacts to it, despite price breaching above it once. Lastly, while a bullish move is likely, we have just seen the previous range high run (wicked above and quickly retraced below), this could be a long liquidity hunt so downside is certainly not impossible here.
Summary:
While a long play here makes sense, we will err on the safe side and continue to watch these levels for a clearer setup as the larger overall crypto market may have a heavy handed impact on NEO at this point.
Resource: neonewstoday.com + www.newsbtc.com + cryptoslate.com
✨ Drop a comment asking for an update, we do NEW setups every day! ✨
Like, Comment & Follow to help the community grow 🎉🎉

$NEOUSD | Time for next big wave? $NEOUSD | Time for next big wave?
Hello friends,
After a few hectic weeks due to the coronavirus, I am back with some analyzes.
First of all i will say that performance out of the past not gives any garranty for the future.
Currently we see some upside movement on $BTC. Also some altcoins are already exploding a little bit like ZILLIQA.
We are currently in Bitcoin's halving and will start moving slowly upwards from now on. Still, I think the ALTS can give the first blow if levels are broken.
This NEO prediction is long term. And I just want to emphasize that I don't think $ 700 NEO is possible this year. I put the pattern here purely because it is POSSIBLE. But that we will get a new ATH someday I am convinced with this great project. Maybe we will be surprised again what we will get for gains this year.
I definitely see a $ 1000 NEO in 2021/2022 so let's keep a close eye on it.
Good luck!
FOLLOW & LIKE. (Leave your long term charts!)

neousdbought some, weekly ema55 is getting horizontal and previous weeks always touched to that line
this time possible to eliminate it

NEO Longer term Elliot wave countHere i have depicted my longer term elliot wave count based on the structure we are seeing and the reaction off the lows. There is a count to say we are getting an impulse off the lows. Again this to me will only be as a result of a C wave and do see us putting in a final low before seeing the true bull run commence.


