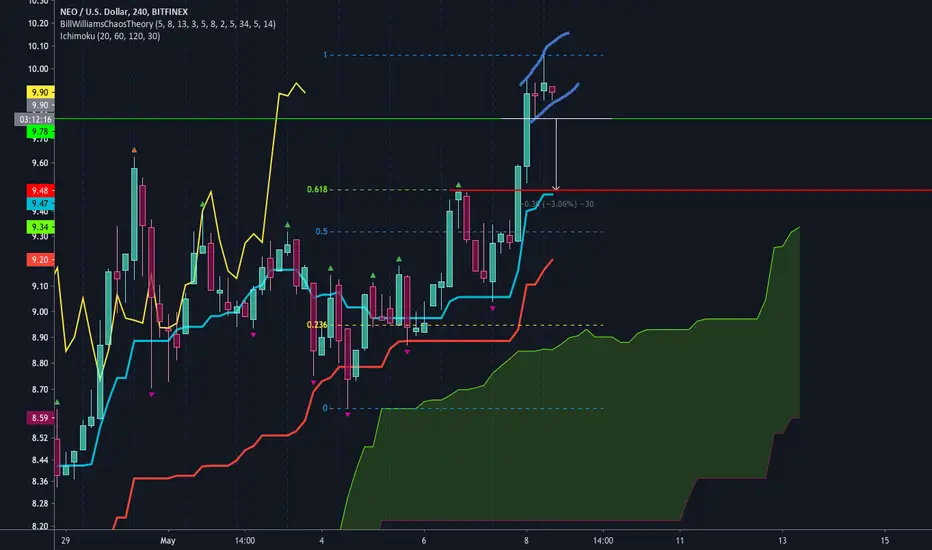
NEO/USDT - a purchase from a key level.a purchase from a key level.
buying from a $10 level.
stop loss for the level.
R/R = 1/15
Push ❤️ if you think this is a useful idea!
Before to trade my ideas make your own analysis.
Thanks for your support!
Neousd

RINSE AND REPEATThis is the pattern I expect to see in the next few weeks. Just an opinion. bitcoin would appear to be obviously bullish, but trading in an obvious fashion and taking trades that are too obvious, is often costly. I do believe the uptrend is strong, but, I think there will be a violent shakeout before price begins reaching new highs.
Good luck traders!

NEO broke strong as we said in previous analysisNeo is at the moment in very good shape also with bitcoin because as we can see whole crypto market is correlated at the moment. But the difference is that we can see on the chart (daily closing is important), neo is LEADING at the moment versus Bitcoin. So that means, even if bitcoin hold position over weekend, Neo will blow this chart to targets we draw in out previous analysis by neousd chart.
From weekly closing we are still in Lower Low range position, but at the moment, neobtc retracement from buyers higher low maintained enough strong, plus the last candle on daily giving us a good signal.
Correlation is proved*
neobtc
For continuation we have to wait for weekly closing to get more info about managing upcomings.
At the moment; neousd strong buy signal;
If you agree give us feedbacks
Elitefxacademy

#neousd decision momentDecision moment in $ neo;
1) Decrease unless the red resistance is exceeded,
2) If the red resistance is passed, the yellow resistance decision point,
3) If the yellow resistance cannot be exceeded, decrease
4) If yellow resistance is exceeded, an increase can be mentioned.
Red resistance (Red area)
Yellow resistance (Yellow area)

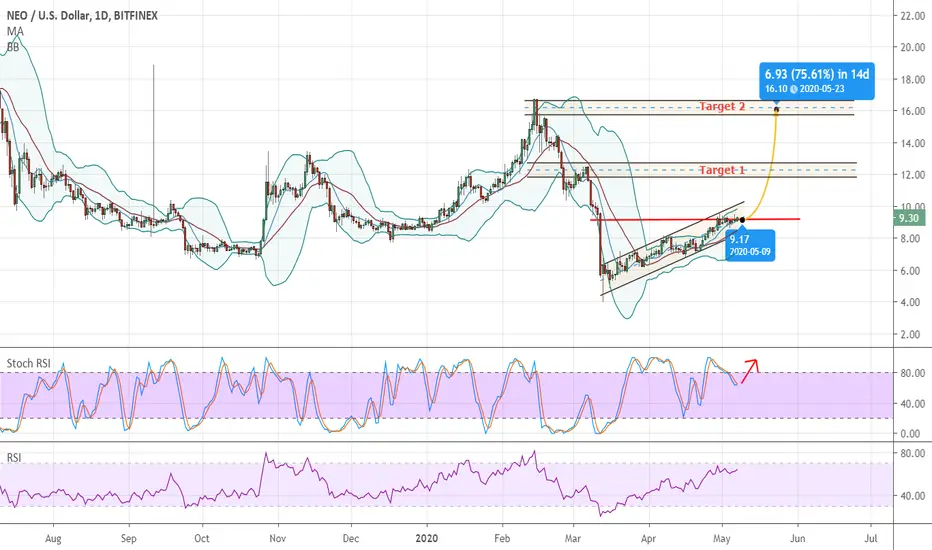
NEOUSD weekly 90% gains BUY NOW(NEW)before we kick start the update. your upvotes/subs
are appreciated.
Why get subbed to to me on Tradingview?
-TOP author on TradingView
-professional chart break downs
-key levels
-no junk on my charts
-frequent updates
-covering FX/crypto/US stocks
-24/7 uptime so constant updates
So without further due. Keep it short/simple and to the
point.
NEOUSD weekly 90% gains BUY NOW(NEW)
IMPORTANT NOTE: this is speculative setup.
results not guaranteed. do your own due dill.
at all times please use a stop loss.
NEOUSD weekly (Finex), XABCD setup, 90% gains
from current price. Recommended strategy:
market BUY now TP is +50% gains.
good luck traders.
get subbed to stay tuned for all the latest updates.
also add likes to support my efforts, thank you.

NEOUSDA quick short on the 4hr down to the 0.618 fib or prior structure / fractal. Looks to be forming an evening star pattern. Not advice.
NEOUSD is about to run - around 30% profits in few daysMany indicators are showing an imminent bullish movement. Stochastic is about to reverse, Parallel channel will not resist the upcoming movement and the weekly indicators are all bullish.
You can see our target in the graphics. Be carefull and protect yourself with stoploss.
------------------------------------------------------
Good Luck
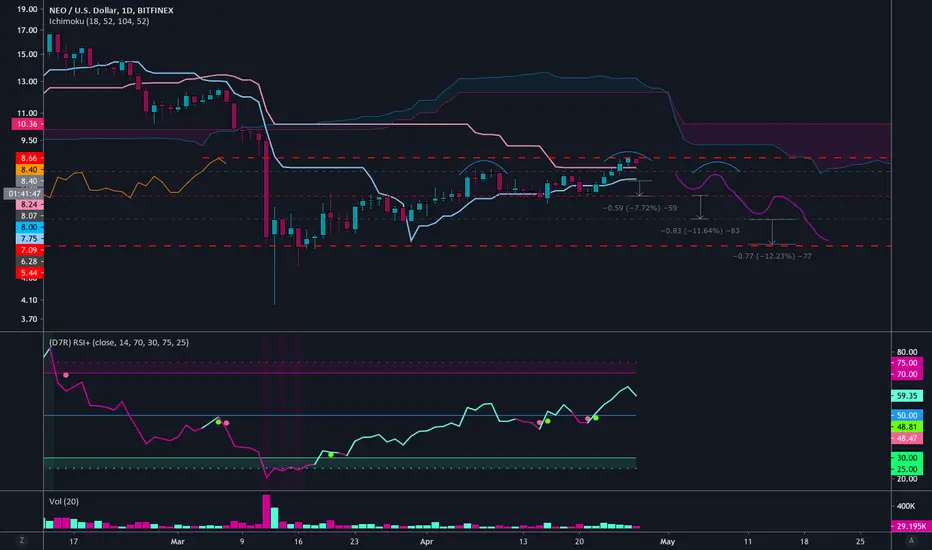
NEOUSDPossible short. Price is below the kumo (cloud) and the chikou spanis (orange line) is below kumo - once price closes below the kijun sen (light pink line)and the kenkan sen (pale blue line) and RSI has turned red and is moving below middle blue line, open a short. Use support lines to take profit and look for change of trend momentum. Not advice.
NEO broke out from bullish pennant. Now time for a retest!Oh NEO how did I miss you. I tried to short you in the middle of the rally and that did not work out well. The trend is clearly up and looks like alts are ready to run. NEO already made considerable gains and now it looks like it is coming back to test this pennant and that would be good time to reload.

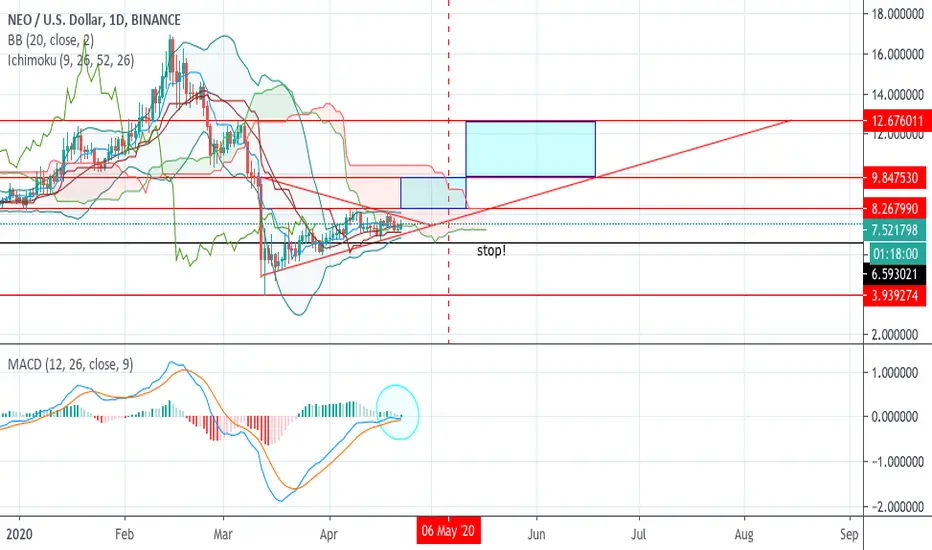
$NEO : Boom boom ... ciao ?Ascending triangle on USDT chart
$NEO seems ready ?
Not a financial advice ?

NEO W bottom -- Breakout short TP- midI’m swamped with errands today so I’m going to have to forgo the oped for this publication. Sorry folks.
W Bottom spotted which led to breakout & higher high retesting as we speak.
In the meantime enjoy the signal; I have always loved NEO — going back to when I first began really getting in the ‘blockchain honeymoon zone/phase’ as I read the whitepaper and roadmap I knew then and there that NEO = to the east what ETH = to the west...but I digress. :)
TP1-2 green horizontals
Red horizontal stop limit (imperative)
Time: I don’t expect this to be longer than a short but I’m keeping it neutral as HODLing for a bit won’t exactly be a high risk type situation and from a cost benefit analysis (most def) worth it; ASSUMING U ALWAYS HAVE YOUR STOP LOSSES ACTIVE.
that’s all.
Peace & Love
@a1mtarabichi
P.S. RVNBTC forming a wedge that’s looking ready to tee up for a parabolic run.
Disclaimer
These statements are not guarantees of future performance and undue reliance should not be placed on them. Such forward-looking statements necessarily involve known and unknown risks and uncertainties, which may cause actual performance and financial results in future periods to differ materially from any projections of future performance or result expressed or implied by such forward-looking statements.

NEOBTC Rising Wedge With Scalping Opportunities [QUICK UPDATES]Hey all, here’s another entry on my tradingview series called 'Quick Updates'.
There's two ways you can trade a rising wedge. You can wait for the breakout and trade the volatility that follows with it, or you can scalp the inner part of the pattern for as long as it holds. Since the whole market is very involatile at the moment, I believe today is a better moment to scalp the inside of the wedge.
On the chart you can see an example of how the price could oscillate, put your buys near the bottom of the support line and the take profit near the top of the resistance line.
--- What is The Quick Update Series All About? ---
I have started a new tag (quickupdates) where I quickly share great opportunities based on TA for shorter timeframes, such as 4h, 1h, and 15m. It will contain a brief explanation with clear and clean charts in order to keep the velocity up and make sure you get to see the opportunities as fast as possible.
Follow me for consistent high quality updates, with clear explanations and charts.
Please like this post to support me.
- Trading Guru
--------------------------------------------------------------
Disclaimer!
This post does not provide financial advice. It is for educational purposes only!

NEO movement within WedgeMovement within wedge can be seen to respect Fibonacci spirals, will this movement continue with a third up-wave? or will this result in a breakout?
This wedge formed is a falling wedge technically however it is quite horizontal

Fibonacci wavesTesting to see if 1.618 follows a bullish trend that was previously seen within the ring of the Fibonacci circle, hence creating the wave.
Here is my original analysis for Fib Waves which is still underway
I believe we will see a repeat bullish momentum throughout the fib ring.
Not much of an analysis for NEO but here we are.

NEO / U.S. DOLLAR (NEOUSD) Weekly & DailyDates in the future with the greatest probability for a price high or price low.
The Djinn Predictive Indicators are simple mathematical equations. Once an equation is given to Siri the algorithm provides the future price swing date. Djinn Indicators work on all charts, for any asset category and in all time frames. Occasionally a Djinn Predictive Indicator will miss its prediction date by one candlestick. If multiple Djinn prediction dates are missed and are plowed through by same color Henikin Ashi candles the asset is being "reset". The "reset" is complete when Henikin Ashi candles are back in sync with Djinn price high or low prediction dates.
One way the Djinn Indicator is used to enter and exit trades:
For best results trade in the direction of the trend.
The Linear Regression channel is used to determine trend direction. The Linear Regression is set at 2 -2 30.
When a green Henikin Ashi candle intersects with the linear regression upper deviation line (green line) and both indicators intersect with a Djinn prediction date a sell is triggered.
When a red Henikin Ashi candle intersects with the linear regression lower deviation line (red line) and both indicators intersect with a Djinn prediction date a buy is triggered.
This trading strategy works on daily, weekly and Monthly Djinn Predictive charts.
This is not trading advice. Trade at your own risk.

Neo the profit machineNeo once again made me profits on my last short and what looks like a confirmed bear flag now. Looking for shorts if we move higher because it could easily break down here also. Will look for better risk-reward. Cheers!

NEO more downside maybeNeo has been the easiest alt to trade lately. I was so unfortunate to close my short early because I was not confident and then bitcoin lost all its support like there wasn't any. Anyway the current formation looks like a bear flag and I think 7.30 is a good entry. As you can see there is lots of overhead resistance. My Stop loss is 7.43. Good luck.

NEOUSD 5daily: 1700% gains (HIGHLY SPECULATIVE)before we kick start the update. your upvotes/subs are appreciated.
Why get subbed to to me on Tradingview?
-15+ years real live trading experience
-TOP Author on TradingView
-professional chart break downs
-key levels
-no junk on my charts
-frequent updates
-covering FX/crypto/US stocks
-24/7 uptime so constant updates
So without further due. Keep it short/simple and to the point.
NEOUSD 5daily: 1700% gains (HIGHLY SPECULATIVE)
IMPORTANT: this is a HIGHLY speculative setup, performance
is not guaranteed, so please use a tight stop loss.
and always do your own due dill. thank you.
Tagged as SHORT as short-term I expect more losses.
Ok guys, how are you doing today? This is NEOUSD
daily we got in spot light right now.
Potential bullish XABCD setup on 5D chart, PRZ
near 1.4-1.6 (best load zone bulls).
TP1 +1200% TP2 +1750%.
Once again, this is highly speculative setup,
returns/performance not guaranteed by any means.
good luck traders!
get subbed to stay tuned for all the latest updates.
also add likes to support my efforts, thank you.

NEOUSDT H4 bearish reversal from resistance and RSI & MacdRSI & MACD bearish divergence, Low volume on resistance zone.
Sell/Short position profit target : 15%
👍


NEO/BTC TA Update (more downside?)NEO/BTC
NEO is on a strong downtrend as the price broke the important support at 1200 sats area.
Since there is not enough consolidation during the uptrend last Oct 2019.
Expect the price to waterfall drop back to previous support or consolidating last Aug-Oct 2019.
The market is full of fear and catching a falling knife today is not a good trading strategy.
Be patient and wait for the whole market to cool-down and find its true value.
