LTC/USD - on a monthly timeframe let's look at interesting level3,71 cents wasn't interrupted. That's a 2017 minimum.
This strait is where the 4 level stopped.
stopped at 6.68.
Mounting under the level will pull the price down to buy there are two levels of which I defined for myself 5,62 and 5,00 $
A break-down of the level 6,68 will allow the price to move to 8,29
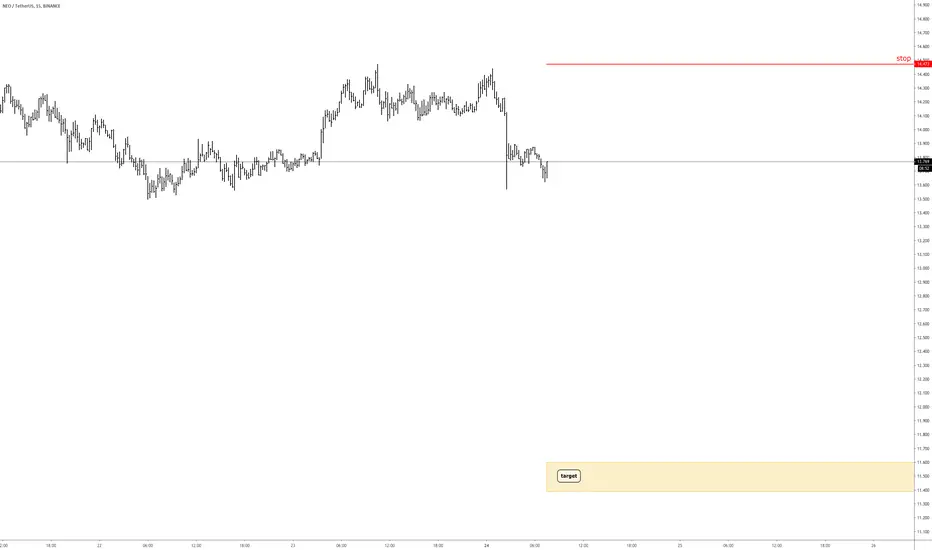
Neousd

NEOUSDT: Back to Dec 2018 levelsNEOUSD is back to 2018 Dec levels and looks just bad.
I'm waiting for a weekly close, it could be a good buy but it needs to show some strength.
I - knife-catching option
II - more cautious approach
Information is just for educational purposes, never financial advice. Always do your own research.

$NEO, Falling below ~10.5$ (30%+ since latest UCTS Sell signal)$NEO / #USD
Falling below ~10.5$ (30%+ since latest UCTS Sell signal on the 1D)
If continuation happens from here (S/R flip may happen (entry)), then aiming for ~8.5$ support level..
#NEO

$NEO, Rebranding to AntShares over next weeks...$NEO / #USD
Rebranding to AntShares over next weeks...
#NEO

!!! ATTENITION: NEO DROPPING TO 7,5$/NEO/BTC PRICE FORECAST Hi guys,
Neo gained solidly so far.
We've seen how strong NEO held while being strongly opressed by Bitcoin.
Now, new has double bearish daily crossover (marked on a chart), so along with Bitcoin, will sink from this instace.
Either open shorts or simply go to USD untill Bitcoin pressure is done (expecting Bitcoin drop to 9150$), therefore Neo should drop massivly and all of a sudden (as B does).
It also peaked on weekly on Stoch RSI and its on a weekly bearish cross right on the top.
Oversold.
Techical side along with RSI, STOCH RSI, MACD and MA and EMA's confirm bearish moomentum (temporarily), but imminently.
Drop levels should be :
1. Clearing your position now.
2. Rebuy NEO at 10.40$
3.Rebuy NEO on 10.30$
4.Rebuy NEO below 8$ and ride it to HH (20$+) previous high
Good luck and feel free to upvote an analysis if you find it useful or share your thoughts on it.
Thanks for reading.
Good luck guys.

NEOUSD formed bullish BAT | Upto 71% profit possibilityHi guys and gals hope you are well, on 2 day chart the NEO Coin has formed bullish BAT pattern and entered in potential reversal zone to move up.
Lest’s dig the pattern deeper to see how perfect this pattern is formed:
After initial leg (X to A) the A to B leg is retraced between 0.382 to 0.50 Fibonacci and then B to C leg is projected between 0.382 to 0.886 of A to B Fibonacci projection area and last leg (C to D) is retraced between 0.786 to 0.886 Fibonacci and now the price action is moving in potential reversal zone of this bullish BAT and now we can expect bullish divergence at any time which will lead the priceline between 0.382 to 0.786 Fibonacci projection of A to D leg.
Buying And Sell Targets:
The buying and sell targets according to harmonic BAT pattern should be:
Buy between: $9.69 to $8.80
Sell between: $11.83 to $15.05
Stop Loss:
The potential reversal zone area which is up to to $8.80 can be used as stop loss in case of complete candle stick closes below this level.

NEO/USD; short position!As BTC/USD is completing its downtrend, NEO/USD COULD complete its pattern...


NEO | USDPerfectly rejected off the $12 resistance i had setup, failed to break and close above. Hit Entry price zones again, will not buy atm till further confirmation. Same Chart , not edited!
FA : NEO has bullish news and upcoming projects, can help boost the price, Right now can be a swing long term play, can take upto a Month ( End of March , if we go sideways).
Lower End: If we fail to hold, and see more of sell off on all crypto, we can see NEO above $8.25 ish. Lets see !

Neo/USDMy prediction of NEO/USD. This is not financial advice.
From what I can see, if you are interested in Neo for mid/long term at these prices aren't bad and set buy ladders at the fib retrace lines if it does fall lower.
Current trend line support is the green one, longer time frame support and resistance are the red lines. If you're longing, set stop loss underneath green trend line support if it doesn't hold, the worst case scenario would be the white squiggly line. Chart is invalid if red support line breaks.

NEO long term rising wedgeNeo has formed a rising wedge, this is a bearish continuation pattern unfortunately.. However this may lead to an inverse H&S, eventually. Short term profits can be made while price is within the wedge, but overall long term the chart pattern is bearish, however the longer term outlook is pretty bullish if you are a dedicated hodler. Short term a rejection may occur at 50MA.

NEO Analysis (Requested)I am proud to say that one of my followers requested me to make a chart for the first time! It's a big milestone for me :)
Shoutout to @dgknsmk for following my charts successfully (quote).
Thanks man!
So, the thing is that many of the crypto charts look almost identical.
I personally try to publish only charts which I would act on and to be honest at the moment I wouldn't buy NEO as I do not see a good setup.
There are many bullish things, and some bearish things which is in most charts, but for me to buy I'd like to see us above the 21 EMA and then down to confirm it as support and bounce from it - then I'd consider going into NEO with a stoploss below the 21 EMA.
Also I wouldn't do long term for now I'd play it level by level - box to box.
On the right screen you can see the 4 levels and we are in the middle of two of them, so I'd wait for us to go into one of them to make a decision.

NEOUSDT: Buying a pullbackLonged Chinese Ethereum targeting resistance ~ $13
If you take a look on the chart you'll see that NEOUSDT is very often has a buyback on a daily from the current zone ($10.5 - $11).
Information is just for educational purposes, never financial advice. Always do your own research.

NEO Symmetrical Triangles?A symmetrical triangle has formed between trendlines on the NEOUSD pair. This is a bullish symmetrical triangle as the first impulse wave was bullish which upon breakout of the triangle will lead to a second wave. A few H&S patterns can also be identified but I haven't listed these as their impact on daily charts is minimal.


NEO/USD | Trade Idea | Swing Long In this Trade, we can see Neo on NEO/USD pair found a temp bottom and bounced. From previous S/R, this price point will play a crucial role. I have been holding Neo for long term, this is a trade setup I might take.
In the Next few hours or days, if Neo can find support from $10.50 - $11 and not break under but a retest bounce, we will see Neo go above $14-16 retesting Resistance again, can take a month to play out.

Daily Chart on NEOUSDTDaily Chart setup on NEO, Watching for a bounce off the 200 day SMA
Lets see if this can ever get back up to $100USD


Neo (NEOUSDT) short.All description on the chart.
Please, don't forget to like and follow.
Thank you.


NEO Up 63% in less than a monthBeen watching NEO very closely as we believe it has a lot of room to run. It's up 63% since it bounce off the 200ma on the daily chart and it just got a golden cross.
We're going to keep this position open until we see any bearish signs.
Shoot us a like and give us a follow as we come back with more updates.
Cheers!
Disclaimer:
I do not provide personal investment advice and I am not a qualified licensed investment advisor. I am an amateur investor.
All information found here, including any ideas, opinions, views, predictions, forecasts, commentaries, suggestions, or stock picks, expressed or implied herein, are for informational, entertainment or educational purposes only and should not be construed as personal investment advice. While the information provided is believed to be accurate, it may include errors or inaccuracies. I will not and cannot be held liable for any actions you take as a result of anything you read here.
Conduct your own due diligence, or consult a licensed financial advisor or broker before making any and all investment decisions. Any investments, trades, speculations, or decisions made on the basis of any information found on here, expressed or implied herein, are committed at your own risk, financial or otherwise.

NEO may need to back off in short term, before power gain.NEO may go some downward to 13,400 - 12,000 area before upward. Actually NEO in bullish trend. But 2 levels need to watch for buy points, for my opinion.
1st, if price down to 13,400 - 12,000 area - which is EMA's give support - I will follow the attitude of the area. If this area make supportive attitude, someone can buy.
2nd, if price breaks up 16,750 resistance level, someone can aim 19,750.
And general view is NEO in a cup or cup-handle formation. So in long term, we can watch for 32,700.
