NEO/USDT – Strong Long-Term Accumulation Zone Detected!
🧾 Full Technical Breakdown (1W Timeframe):
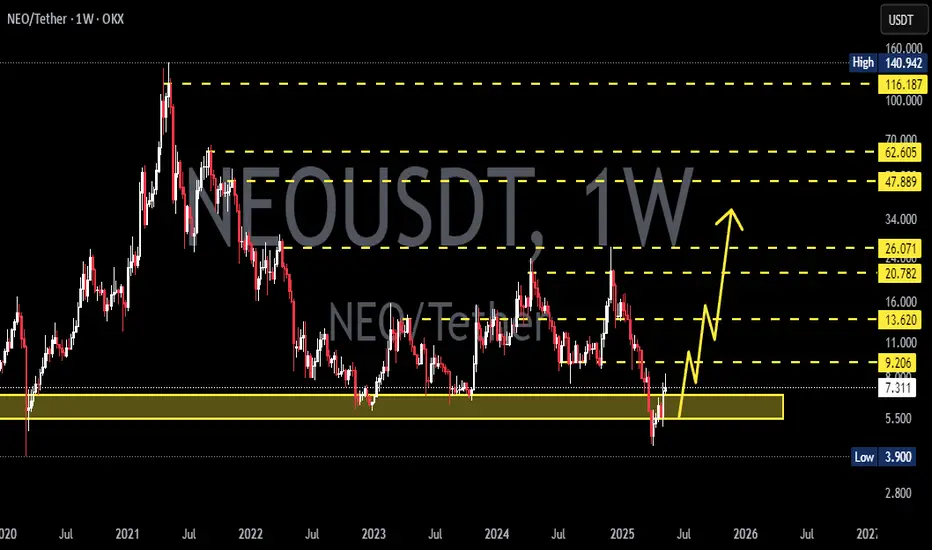
NEO is currently revisiting a multi-year demand zone in the range of $3.90 – $4.50, a historically critical level where price has previously bounced before initiating massive rallies.
This zone has acted as a strong accumulation base during:
March 2020 crash
Mid-2019 correction
And now again in 2025 — making this the third test of the zone in a macro cycle.
The recent candlestick behavior shows price compression with long wicks, signaling demand absorption and the potential emergence of buyers.
📐 Key Pattern Formation:
Possible Double Bottom or Adam & Eve Reversal Pattern forming on the weekly chart.
Combined with horizontal support and psychological round number zone ($4–$5), this can be the foundation of a long-term trend reversal.
Price has entered a volatility contraction phase, which often precedes an impulsive breakout.
📈 Bullish Scenario:
If the support holds and we see a breakout with increasing volume:
1. Short-Term Targets:
$6.85 (local resistance)
$9.10 (previous consolidation block)
2. Mid-Term Targets:
$14.31 (last major breakdown level)
$21.54 (multi-month range resistance)
3. Long-Term Targets:
$29.38 – psychological level from previous cycle
$47.88 – historical supply zone
$62.48+ – potentially a multi-year bullish cycle if macro market turns risk-on
Watch for:
Bullish engulfing or hammer candle on the weekly
Breakout from descending structure with strong RSI divergence
Volume expansion above key resistances
📉 Bearish Scenario:
If the yellow support box fails:
Breakdown below $3.90 may signal continuation of macro downtrend.
Immediate bearish targets: $3.30 (2019 low), followed by price discovery below.
Invalidates the bullish reversal structure.
Could coincide with overall crypto market capitulation.
Risk Mitigation:
Use tight stop-loss below $3.90 if entering early
Scale into positions gradually (DCA) instead of full entries
🔥 Strategic Summary:
> “High-conviction zones are not found often — but this looks like one of them.”
With confluence of:
Historical demand zone
Psychological support
Pattern structure
Volume tapering near bottom
…this could be one of the last best accumulation zones for NEO if the market recovers over the next 6–12 months. A macro trend reversal could offer 4x–10x returns if history plays out once again.
📊 Resistance Levels to Watch:
$6.85
$9.10
$14.31
$21.54
$29.38
$47.88
$62.48
$115.28 (macro ATH level)
#NEOUSDT #NEOTechnicalAnalysis #CryptoReversal #BullishCrypto #NEOAccumulation #AltcoinBreakout #NEOPricePrediction #WeeklyCryptoAnalysis #SupportAndResistance #NEOChart #DoubleBottomPattern
Neousdtrading

NEOUSDT 1W AnalysisNEO ~ 1W Analysis
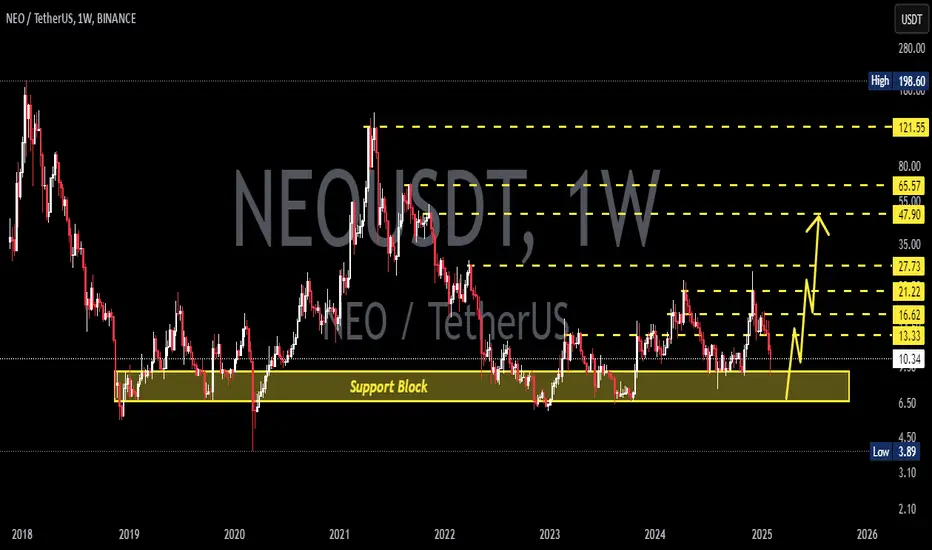
#NEO This is the lowest support block for now. Buy gradually from here with a short term target of at least 20%+

NEOUSD: Minimum target for the end of this Cycle $30.Neo turned marginally bullish on its 1D technical outlook (RSI = 56.743, MACD = 0.356, ADX = 25.407) as it has validated the start of the new bullish wave, rebounding on the same level as it did on March 9th 2020. This is the least aggressive Bull Cycle for new but the presence of a HH trendline implies that a Cycle high can be minimum made on it. With the 1W MACD about to form a Bullish Cross, we expect the HH to get hit by the end of the year (TP = 30.000).
## If you like our free content follow our profile to get more daily ideas. ##
## Comments and likes are greatly appreciated. ##

NEOUSDT 1W AnalysisNEO ~ 1W Analysis
#NEO Buy gradually from here if you still have confidence in this coin with a short term target of at least 20%+.
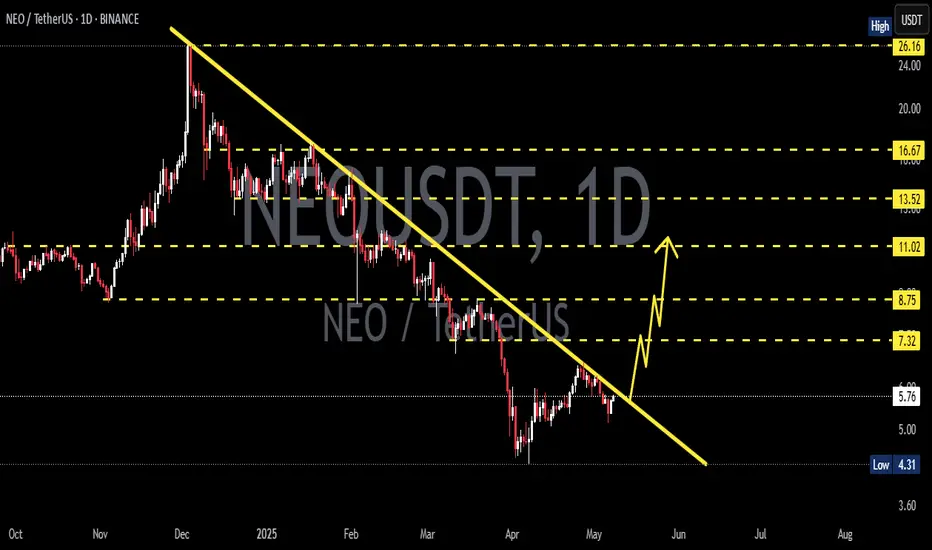
NEOUSDT 1D AnalysisNEO ~ 1D Analysis
#NEO Buy after successfully breaking this resistance line with a short term target of at least 10%+ from here.
NEOUSDT 1WNEO ~ 1W Analysis
#NEO Buy gradually from here with a short -term target of at least 20%+. This is the lowest support for now.

NEOUSDT 1WNEO ~ 1W Analysis
#NEO Buy from here if you still have a Conviction on this coin with a minimum target of 20%+
NEOUSDT 1WNEO ~ 1W
#NEO If you still have Conviction on this coin,. Buy gradually after breaking through the resistance line of this pattern. with a minimum target of 20%+

NEOUSDTNEO ~ 1W
#NEO If you still have Conviction on this coin,. This support block will be a very good buying place so far,. with a minimum target of 20%++

NEO Long IdeaNeo Buy zone is $15 , $17 for me and I think I will buy from there if it falls. I think these two scenarios will develop, stay tuned. fibonacci levels are very important.

NEOUSD: This rally is targeting 100.00NEOUSD is on very healthy bullish technicals on the 1D timeframe (RSI = 67.236, MACD = 1.232, ADX = 36.412) and just crossed over the 1W MA200 for the first time since April 4th 2022. The blueprint of this Cycle is the same as the previous. The token bottoms on a Triangle shaped double bottom and then starts rising on a Channel Up before it breaks upwards aggressively for the Cycle's final rally.
It seems that now we are entering a short term consolidation phase which will give way to the final rally. We are expecting a direct hit on the LH trendline (TP = 100.00).
## If you like our free content follow our profile to get more daily ideas. ##
## Comments and likes are greatly appreciated. ##

NEO/USD Wedge Pattern Breakout OpportunityOverview:
NEO/USD is currently forming a wedge pattern, indicating a potential breakout opportunity. This pattern suggests a period of consolidation and uncertainty in the market.
Breakout Potential:
A breakout from the wedge pattern could signal significant price movements. Traders should watch for confirmation through increased volume and decisive price action before entering positions.
Entry Strategy:
Traders may consider entering:
- Long Position: Above the upper trend line with confirmation of bullish momentum.
- Short Position: Below the lower trend line with confirmation of bearish momentum.
Risk Management:
Implement strict risk management measures, including stop-loss orders and proper position sizing, to mitigate potential losses.
Conclusion:
The wedge pattern in NEO/USD presents a trading opportunity for vigilant traders. By monitoring price action and volume dynamics, traders can identify entry points while managing risk effectively. Caution and adherence to risk management principles are essential in navigating the forex market's volatility.

#NEOUSDT $NEOUSDT #NEO Long BiasIf price stays above the Green Box then you can take profit on these levels. Good Luck.

NEOUSDI am expecting NEOUSD to break the previous mini high in order for it to continue it moves upward to the previous higher high of the main upward trend which is my take profit point.

NEO coin forming bullish Cypher for upto 19% pumpHi dear friends, hope you are well and welcome to the new trade setup of NEO coin with US Dollar pair.
Previously we caught almost 90% pump of NEO as below:
Now on a 2-hr time frame NEO is forming a bullish Cypher for the next price reversal.
Note: Above idea is for educational purpose only. It is advised to diversify and strictly follow the stop loss, and don't get stuck with trade.


Neo trade idea 15/1/2023. Sell to buy later cheaperI think we will be heading to 4 or 4.5. I will be interested to buy at these prices or even less. Let me know what do you think
#neocoin #neonews #crypto #cryptobullrun #cryptocurrency #bulltrap

Neo Its time you took the redpillWell, Bitcoin has taken us for a ride Padawan, Totally oversold, what does this mean- Deploy the ghost protocol.

NEOUSDT , We are near important supportHello guys
In here according that we shown on chart the trend is downward and we have new breakwave
The breakwave made and now we need to have some correction of this fall then we can take short position
Maybe the price can go more up but the important things is the trend downward and only we should take sell position
Previous analysis :
Dont forget guys use stop loss and attention to money management
Good Luck
Abtin

Neo- Towards 75 resistance zone?October was a month of range trading for Neo, with the price trading between 37 zone support and 47 zone resistance.
At this point, the coin is building up momentum for a break and a close above resistance should accelerate gains towards the 75usd zone
On the other hand, a drop under 37 would be bearish and can lead to a new local low around 20usd.
I'm bullish on this coin and I will look to buy for a trade with a good R:R

NEOUSDT , Chart is talking to us :D :D :DGood mornig everybody
I hoped that last week everyone get profit from the markets
In here we have one the amazing chart , because of the breakwave of it
In dynamic resistance , we broke the trendline and we pullbacked to it but in static resistance we are making the downward trend and we expect that the price can one more time back to the support zone for stop huntering the positions and after that can go for new rally for the new TP
In the buy zone we should check the chart in multi-time frame and at first we should take signal then we can buy and take long position until the targets reach
BECAREFUL , One the prediction on chart is the price can come near the stop loss and suddenly can touch it and activate the SL buy the analysis is valid and we are ready to find another situation for entrance and take position and buy on chart ,
Dont forget stop loss and money management
Good Luck
Abtin

NEOUSDT long ideaPrice is getting reaction from both from rising support and flat resistance area ( at 48.xx levels). seems it will brake above the resistance and will move to the next resistance area 53.xx usd level. if we pass 53.xx level and stay over it, 100usd or more will come easily. So we can see parabolic rising over 53-54 usd

NEOUSDT : 1D TF Let's go for long :))As we can see, after breaking its downward trend, the price is gathering strength to start a strong climb.
In order to buy, the SL (stop loss) and capital management must be observed.
All resistances and TPs (take profits) are marked on the chart.
(DYOR)
