BITCOIN DOMINANCE Update (12H)This analysis is an update of the analysis you see in the "Related publications" section
After hitting the two resistance lines marked on the chart (yellow circle), we saw a reaction, but it doesn’t seem like the trend has changed.
There’s a possibility that a double top could be forming on the dominance chart.
This suggests that selling pressure on altcoins may continue until this index approaches its peak zone.
For risk management, please don't forget stop loss and capital management
Comment if you have any questions
Thank You
Neo Wave

Solana(based on NEowave)I consider this as a triangle but under the price zone which is 139 it tells us its going to make a diamond diametrical.

Will Natural Gas Prices Increase?Weekly Cash Data shows a sharp downtrend that stopped at 2.05 and then formed a sideways trend. Given the size of wave-(c) and the time of the waves, it seems that a reverse contracting triangle pattern is forming.
Currently, wave-(d) has ended and wave-(e) has begun. Under normal circumstances, we expect this wave to decrease to the point indicated by the red arrow, and in terms of time, this wave can continue until the time range of August 12-September 12 unless a political or geopolitical event occurs that causes wave-(e) to be shortened.
So, to trade, you must have a strategy along with analysis.
Good luck
NEoWave Chart

BITCOIN New Update (4H)This analysis is an update of the analysis you see in the "Related publications" section
In the previous analysis, we mentioned that you should avoid looking for sell/short positions, as Bitcoin's price pattern was designed to trap short positions. The price followed the direction of the previous yellow arrow as anticipated.
Currently, the major resistance zone for Bitcoin on the chart is the red area. In this zone, a complete bullish pattern could potentially form | or at the very least, one leg of a bullish pattern may be completed.
Let’s see how it plays out.
For risk management, please don't forget stop loss and capital management
Comment if you have any questions
Thank You

GRT Analysis (12H)From the point where we placed the red arrow on the chart, it seems that a large-degree triangle on the GRT chart has completed, and we are now in a new wave sequence.
In these new downward waves, wave A/W has completed, and it now appears we are in the middle of wave B/X.
We are looking for a rebuy opportunity around the green zone.
It is expected that during the middle of wave B/X, there will be a correction down toward the green zone, followed by an upward move to continue wave B/X.
A daily candle closing below the invalidation level will invalidate this analysis.
For risk management, please don't forget stop loss and capital management
Comment if you have any questions
Thank You

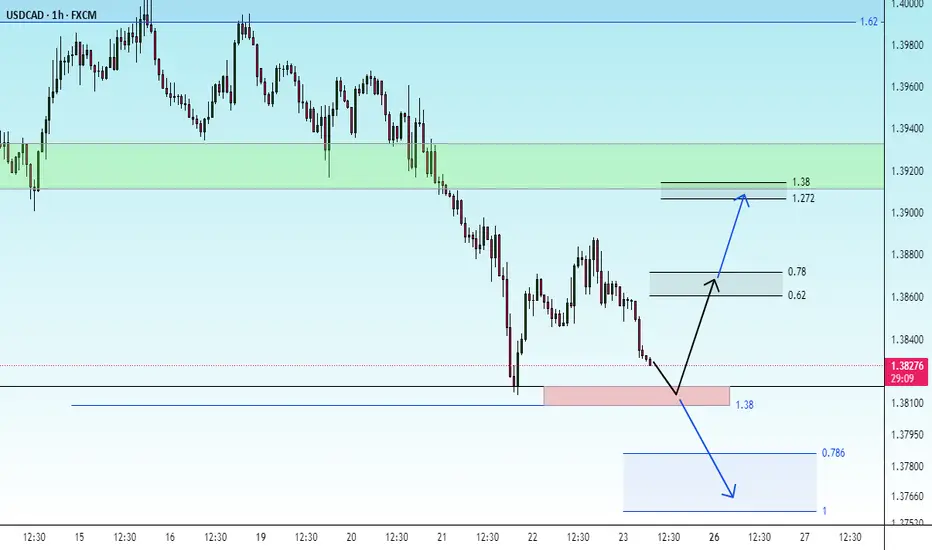
check the trendThe correction and fluctuation trend is expected to form according to the specified paths. Then, the continuation of the upward trend to the specified resistance levels will be possible.
If the support area and the support trend line are broken, the downward trend to the next support area will be possible.

uptrendThe price is expected to consolidate above the support area and continue the upward trend. A break above the 161.8% level can be a confirmation of the continuation of the upward trend.

BSV Rebuy Setup (12H)Since we placed the green arrow on the chart, it seems that the BSV correction has started. This correction was a butterfly diametric pattern that has now completed.
From the point where we placed the green arrow, the bullish phase of BSV appears to have begun, which should have at least 3 waves. It seems the first wave is complete, and we are currently in the second corrective wave.
We are looking for buy/long positions around the green zone to form wave C of the new bullish phase.
A daily candle closing below the invalidation level will invalidate this analysis.
For risk management, please don't forget stop loss and capital management
When we reach the first target, save some profit and then change the stop to entry
Comment if you have any questions
Thank You

XMR LOOKS SUPER BULLISH (1W)Before anything else, pay attention to the timeframe of the analysis; it’s weekly.
It seems that wave C of the weekly triangle has ended, and the price has entered wave D.
Wave D could progress up to the ATH or even slightly exceed it.
For wave E, we will have a rejection, and then the main upward move will form.
On the chart, we have marked a green line as our KEY LEVEL. As long as the price stays above this line, XMR is super bullish.
A weekly candle closing below the invalidation level will invalidate the analysis.
For risk management, please don't forget stop loss and capital management
Comment if you have any questions
Thank You

BAN Analysis (8H) This coin is somewhat risky and highly volatile, so only allocate a small amount of capital.
From the point where we placed the green arrow on the chart, a bullish phase seems to have formed on the BAN chart. This phase appears to be a diametric pattern, and we are currently in its final wave, wave G.
If the price reaches the red zone, we can look for sell/short positions.
A daily candle closing above the invalidation level will invalidate this analysis.
For risk management, please don't forget stop loss and capital management
Comment if you have any questions
Thank You

DOGE Analysis (4H)It appears that Dogecoin's correction has started from the point where we placed the red arrow on the chart. This correction seems to be a flat pattern, with the first two parts forming a diametric and a triangle.
If the price reaches the green zone | which is a key area | we can start looking for buy/long positions.
Targets : 0.23092 _ 0.25283 _ 0.29426 _ 0.32217
A daily candle closing below the invalidation level will invalidate this analysis.
For risk management, please don't forget stop loss and capital management
Comment if you have any questions
Thank You

JTO Buy/Long Setup (1D)It appears that JTO is in a bearish pattern on the higher timeframe, but it shows a bullish structure on the lower timeframes and could move to the upside.
The trigger line has been broken, and we have a bullish CH (Change of Character) on the chart.
We are looking for buy/long positions around the SWAP zone.
A daily candle closing below the invalidation level would invalidate this outlook.
For risk management, please don't forget stop loss and capital management
When we reach the first target, save some profit and then change the stop to entry
Comment if you have any questions
Thank You

correctionIt is expected that a trend change will take place within the current support range and we will witness the start of an upward trend. Otherwise, the downward trend will continue to the next support levels.

check the trendIt is expected that the upward trend will continue until the specified resistance levels and then we will witness the beginning of a downward trend.
If the price breaks through the red resistance area, the continuation of the upward trend is possible.

check the trendIt is expected that a trend change will occur within the specified support area and we will witness the beginning of an upward trend. Otherwise, if the support area is broken, the continuation of the downward trend is likely.
uptrendThe upward trend is expected to continue until the specified resistance levels. If the price breaks through the support area and the support trend line, the beginning of a downward trend is likely.

check the trendAs long as the price fluctuates above the green support level, a continuation of the uptrend is likely. Otherwise, a continuation of the downtrend to the next support level and the previous low is possible.

uptrendThe current uptrend is expected to continue to the previous high, then a continuation of the uptrend is likely.
If the price breaks the support level and the support trend line, a continuation of the downtrend is likely.

check the trendThe current support level is expected to change and the uptrend will begin. A break of the green resistance level will confirm the uptrend.

uptrendIt is expected that the downward trend will end within the current support range and we will see the beginning of the upward trend. If the support range is broken, a continuation of the downward trend to the next support levels is possible.

possibility of uptrendIt is expected that the price will consolidate above the current support range and then continue the upward trend. Otherwise, if the support range is broken, a continuation of the downward trend to the specified support levels is possible.

possibility of uptrendIt is expected to fluctuate within the current resistance range and then continue the upward trend. If the price breaks the green support range, a continuation of the downward trend is likely.

Altcoins: Analyzing the Ecosystem Beyond BitcoinAltcoins — short for “alternative coins” — encompass all cryptocurrencies other than Bitcoin. Emerging as early as 2011, they have since evolved into a diversified sector aiming to improve upon Bitcoin’s limitations or explore new use cases.
Classification of Altcoins
Smart Contract Platforms (Ethereum, Solana): Enable programmable finance and decentralized applications (dApps).
Privacy Coins (Monero, Zcash): Focus on anonymity and data protection.
Utility and Infrastructure Tokens (Chainlink, Polkadot): Facilitate blockchain communication and ecosystem functionality.
Market Analysis
In 2024, altcoins made up roughly 48% of total crypto market capitalization.
Ethereum continues to lead as the foundational layer for DeFi, NFTs, and DAOs.
New entrants like Avalanche and Near Protocol are gaining ground through scalability improvements.
Key Strengths and Challenges
Strengths:
Drive innovation in DeFi, Web3, and tokenized finance.
Foster scalability, low-cost transactions, and cross-chain connectivity.
Challenges:
Fragmentation: Competing standards hinder interoperability.
Security Risks: Vulnerabilities in smart contracts can lead to major hacks.
Regulatory Exposure: SEC scrutiny may classify some tokens as securities.
Conclusion
Altcoins represent the innovative edge of the crypto sector. For investors, they offer high-reward opportunities, but also come with elevated risks. Understanding their ecosystems is essential for long-term participation.
