BTC DOMINANCE Looks Bearish (1D)Bitcoin Dominance seems to have completed its bullish structure.
An order block is forming and has been broken to the downside, a trigger line has been lost, and wave g has come to an end.
If Tether dominance also declines, altcoins may remain in the green.
The 62 level is the target drop zone for this index.
For risk management, please don't forget stop loss and capital management
Comment if you have any questions
Thank You
Neo Wave
PHB Looks Bullish (1D)It appears that wave E has ended after a long consolidation and the formation of a double bottom. A key trigger line has been broken, and the price has reclaimed the flip zone (marked in green).
As long as the green zone holds, the price can move toward the targets and the red box.
The targets are marked on the chart.
A daily candle closing below the invalidation level will invalidate this analysis.
For risk management, please don't forget stop loss and capital management
Comment if you have any questions
Thank You
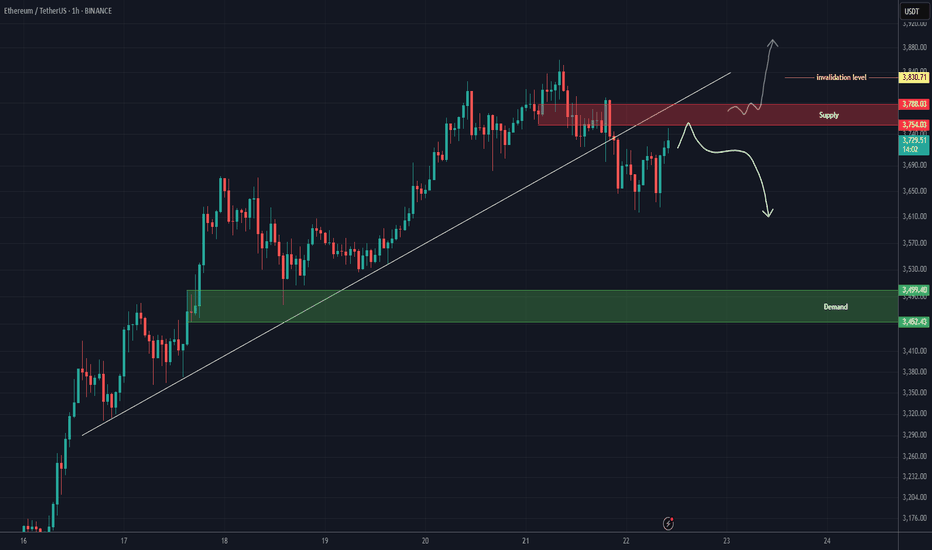
ETH analysis (1H)A trendline has been broken, and a resistance zone has formed on the chart. As long as Ethereum fails to hold above the red zone, the price may experience a drop.
The green box can be considered the target.
If the price stabilizes above the red zone and a daily candle closes above the invalidation level, this analysis will be invalidated.
For risk management, please don't forget stop loss and capital management
Comment if you have any questions
Thank You
Best Meme Coins Live News Today: Latest Opportunities & UpdatesIn the fast-paced world of meme coins, today’s market presents fresh opportunities for both new and seasoned investors. With community-driven narratives dominating, identifying the best meme coins means staying updated on project fundamentals, social sentiment, and tokenomics. Here’s a detailed overview of the live scene and emerging opportunities shaping the meme coin landscape in 2025.
1. ShibaX (SHIBX): Riding the Dog-Themed Wave
Why it’s trending:
ShibaX combines the beloved Shiba Inu dog theme with practical features—NFT integration, staking, and cross-chain bridges. These elements have reignited investor interest.
Latest updates:
New staking platform launched on Ethereum and BNB Chain, offering up to 20% APY.
Roadmap reveal includes “ShibaX Arcade,” a gaming platform with meme lore-based mini-games.
DeFi integrations allowing SHIBX to be used as collateral in lending protocols.
Investor take: Strong branding with concrete utility upgrades could offer both hype-driven spikes and sustained growth.
2. BabyDoge Gold (BABYG): Rising from Origins
Why it’s trending:
A spin-off from the original Baby Doge Coin, BabyDoge Gold aims to redefine tokenomics with enhanced burn mechanisms and community engagement.
Latest updates:
Fix for liquidity token bug was addressed within 24 hours—boosting retail confidence.
Marketing campaign “Golden Paw” launched, expanding reach via YouTube and local crypto meetups.
25% token burn event announced to reduce supply and strengthen price over time.
Investor take: While still early-stage, BABYG’s quick fixes and supply-control measures are positive indicators—though caution remains necessary.
3. Floki EDU (FLOKIEDU): Meme Coin with Purpose
Why it’s trending:
Floki EDU differentiates with a strong emphasis on educational initiatives, publishing free courses about token fundamentals, security, and blockchain literacy.
Latest updates:
Partnership with a blockchain academy in India, enabling FLOKIEDU use in classrooms.
Interactive Telegram quiz bots reward users with tokens.
Pending centralized exchange listings, subject to community votes.
Investor take: Combining mission-driven goals with token utility adds long-term resilience beyond hype.
4. ElonDoge (ELDOGE): Fan-Focused Franchise
Why it’s trending:
Capitalizing on Elon Musk’s Dogecoin fandom, ElonDoge remains a cult favorite with its viral campaigns and high-yield staking pools.
Latest updates:
Limited-time pools with 150% APY to attract quick inflows.
Merchandise integration includes NFTs and apparel tied to Elon-themed meme culture.
"Space Chatter" Telegram community holds frequent AMAs, enhancing engagement.
Investor take: High-risk, high-reward dynamics—suitable for short-term momentum traders rather than long-term holders.
Final Thoughts
Despite the chaotic nature of meme coins, coherence between community strength and utility can spell significant returns. Coins like ShibaX and Floki EDU have moved beyond mere novelty, offering real functionality. Meanwhile, BabyDoge Gold and ElonDoge are high-volatility assets rooted in meme culture.
For traders, blending these project types can hedge risks. Stay vigilant, track updates, and always manage positions with discipline—this approach ensures readiness for the next meme market surge.
Pi Network Faces Scrutiny as Market Cap Hits $3.4BPi Network, the mobile-first crypto project that attracted millions of users with its "mine-on-your-phone" concept, is facing growing scrutiny as its market capitalization has surged to $3.4 billion, despite lingering concerns over its actual utility and use cases. As hype continues to propel its valuation, the community and broader crypto market are demanding answers: What can Pi really do?
Background and Growth
Launched in 2019 by a team of Stanford graduates, Pi Network aimed to democratize cryptocurrency mining by enabling users to earn tokens on their smartphones without expensive hardware. Through aggressive referral-based marketing and a user-friendly interface, it reportedly attracted over 50 million users globally.
However, after years in beta and a still-limited mainnet release, the Pi token is not yet fully tradable on major exchanges, and its price remains speculative. Despite that, Pi's market cap is estimated at $3.4 billion based on limited OTC (over-the-counter) trading and projected supply metrics.
Utility Concerns Intensify
With a large user base and growing token valuation, the pressure is on for Pi Network to deliver tangible value. Key concerns include:
Lack of utility – Most users cannot use Pi to pay for goods or services in real-world scenarios.
No open mainnet – While a “closed mainnet” has launched, the network still lacks full public blockchain access, hampering transparency and developer participation.
Centralization – Pi’s governance and decision-making remain opaque, raising questions about decentralization and long-term sustainability.
No listings on major exchanges – Without real-time market discovery, token valuation remains speculative and potentially misleading.
Community Reaction
Many early adopters continue to support Pi, viewing it as a long-term project that needs time to mature. Some local communities even organize Pi-based bartering systems. However, critics argue that without real-world use cases, Pi remains a glorified points system rather than a functional cryptocurrency.
The disconnect between market cap and utility has fueled concerns of a speculative bubble. In fact, some compare Pi to past projects like BitConnect, which promised much but delivered little.
The Road Ahead
To maintain its momentum and justify its valuation, Pi Network must:
Open its mainnet to public interaction and developer contributions.
Secure listings on reputable exchanges to enable transparent price discovery.
Establish real-world utility, such as integration with e-commerce, payments, or DeFi applications.
Improve transparency around tokenomics, governance, and long-term roadmap.
Failure to address these areas could result in an erosion of community trust and capital flight to more proven projects.
Conclusion
Pi Network’s $3.4 billion market cap is both impressive and problematic. It highlights the power of community-driven growth but also underscores the risks of hype-driven valuations. As the crypto market matures, utility—not just marketing—is what will determine long-term success. For Pi, the clock is ticking to move from potential to performance.
UXLINK ANALYSIS (8H)From the point where we placed the green arrow on the chart, an expanding triangle began, and the pattern completed at the point where we placed the red arrow.
Now, the price seems to be in a correction, which appears to be either a Diametric or Symmetric pattern. Currently, it looks like we are in wave D of this structure.
We expect a drop from the red box. Demand 1 is a temporary rebuy zone, while Demand 2 is a suitable area for a set-and-forget approach with good gains.
Let's see what happens!
For risk management, please don't forget stop loss and capital management
When we reach the first target, save some profit and then change the stop to entry
Comment if you have any questions
Thank You
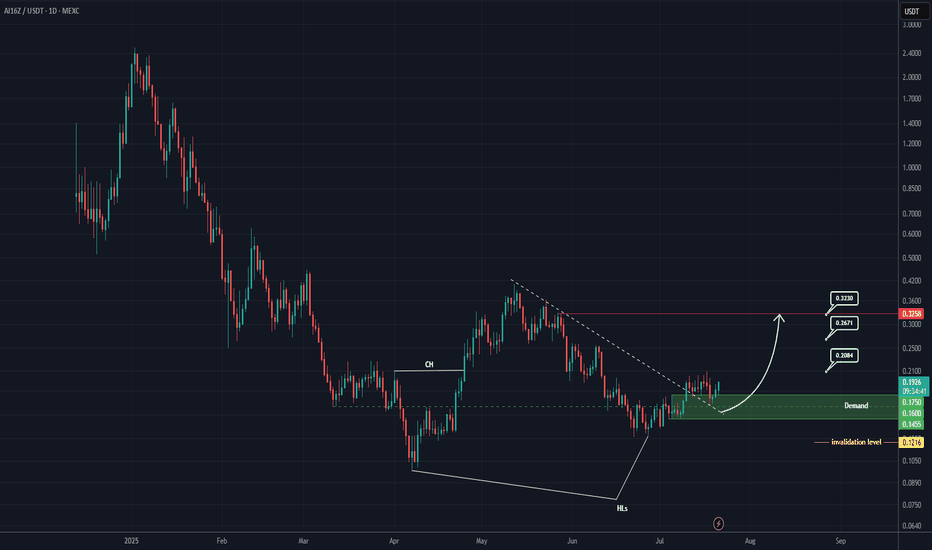
AI16Z Analysis (1D)Given the bullish CH, the breakout of the trendline, and the formation of a support zone, it appears that this token is aiming to move toward the targets marked on the chart.
Additionally, a double bottom pattern is visible at the lows, and higher lows have been recorded for this asset.
A daily candle closing below the invalidation level would invalidate this analysis.
For risk management, please don't forget stop loss and capital management
When we reach the first target, save some profit and then change the stop to entry
Comment if you have any questions
Thank You
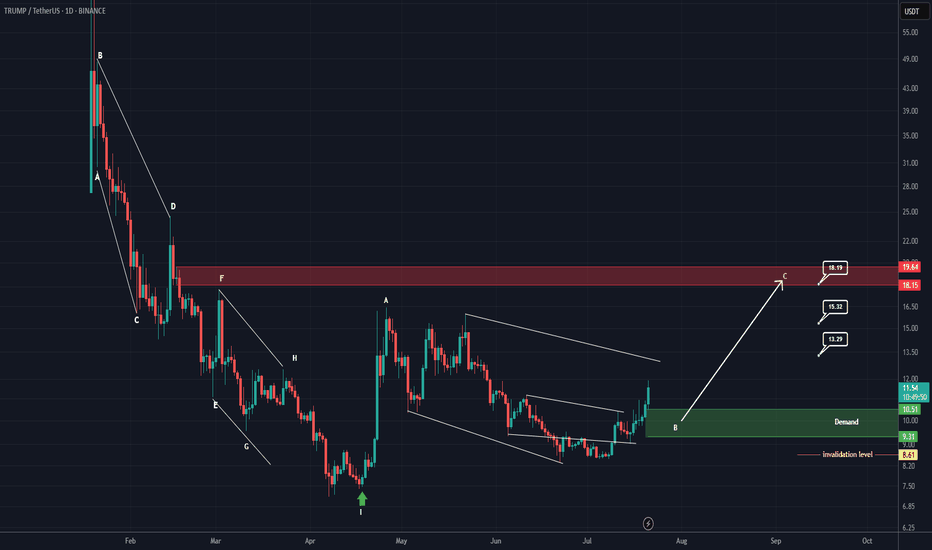
TRUMP Looks Bullish (1D)It seems that the bullish phase of the Trump coin has started from the point where we placed the green arrow on the chart.
We appear to be at the end of wave B of the bullish phase. As long as the price holds above the green zone, it can potentially move toward the targets marked on the chart.
A daily candle closing below the invalidation level would invalidate this analysis.
For risk management, please don't forget stop loss and capital management
Comment if you have any questions
Thank You
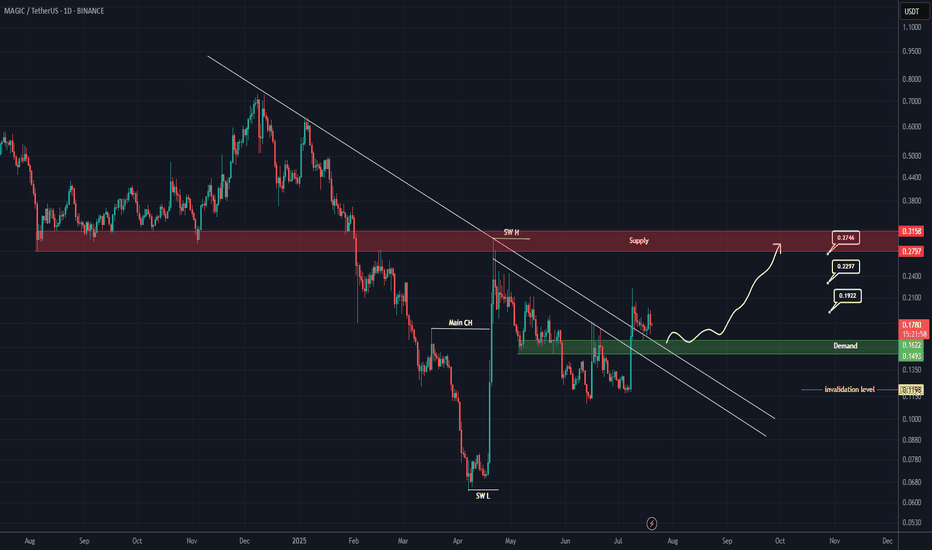
MAGIC Buy/Long Setup (1D)On the chart, an important trigger line has been broken. A strong bullish CH (Change of Character) is also visible on the chart.
The green zone is a low-risk area for a rebuy.
Targets are marked on the chart.
A daily candle close below the invalidation level will invalidate this analysis.
For risk management, please don't forget stop loss and capital management
Comment if you have any questions
Thank You
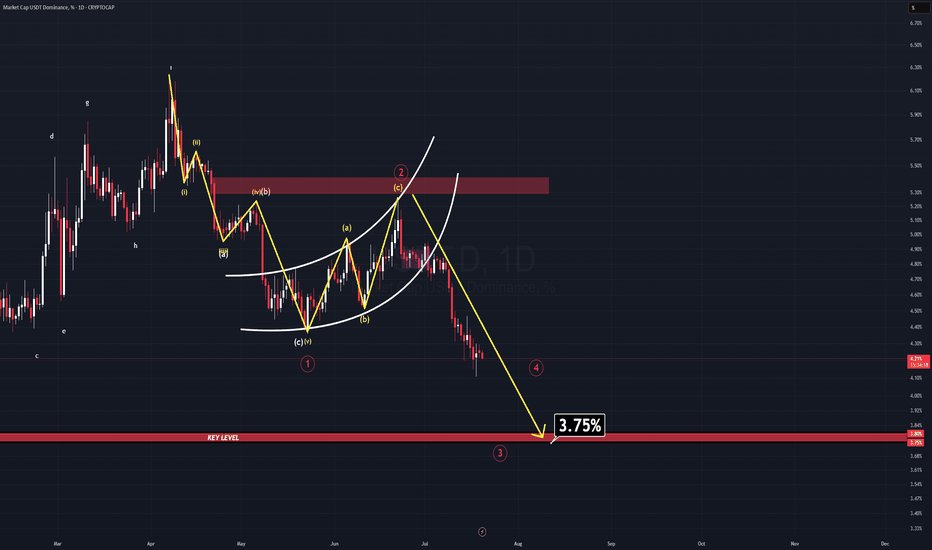
USDT DOMINANCE NEW UPDATE (1D)In a previous analysis, I mentioned that the long-term outlook for this parameter (USDT.D) remains extremely bearish. At the time, a bear flag was clearly visible—but it hadn’t been broken yet.
Well, now it has.
The breakdown confirms the bearish continuation, and there’s still more room to fall. As USDT.D continues to descend towards the projected target for Wave 3, we are likely to see a new All-Time High in Bitcoin, accompanied by a strong rally in many altcoins.
The main target for Wave 3 sits at 3.75%—a historically critical level. For years, USDT.D has never fallen below this zone, making it an extremely strong support area.
⚠️ Reminder: Consider taking profits when USDT.D approaches the 3.80–3.75% region. A reversal or temporary bounce is highly likely there.
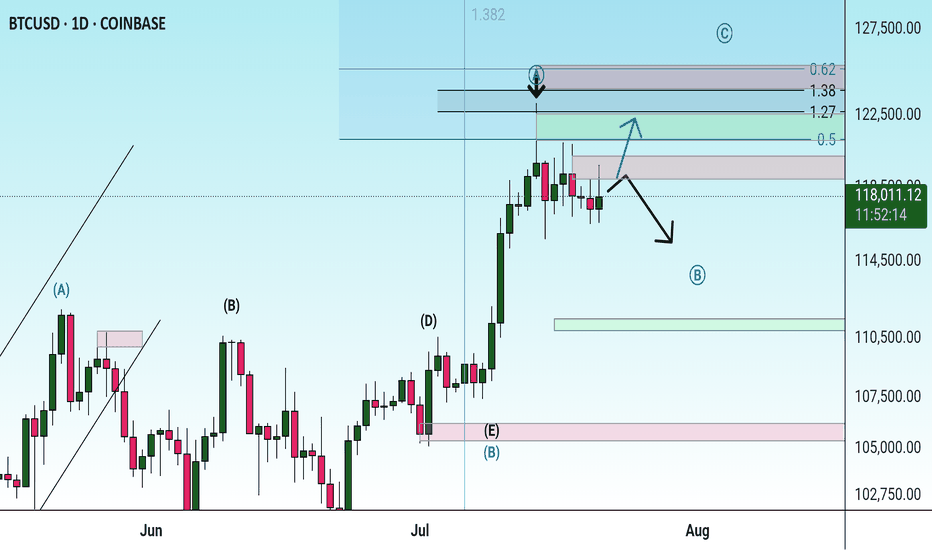
Bitcoin is still bullish (4H)Bitcoin appears to be in a dual bullish structure, currently in the second bullish phase following wave X.
Considering the expansive nature of the correction in the second pattern, it seems we are within an expanding triangle or a diametric structure.
Based on the duration of wave C, it appears that the bullish wave of the second structure is not yet complete.
We expect such fluctuations for Bitcoin in the coming period.
A daily candle close below the invalidation level would invalidate this outlook.
For risk management, please don't forget stop loss and capital management
Comment if you have any questions
Thank You
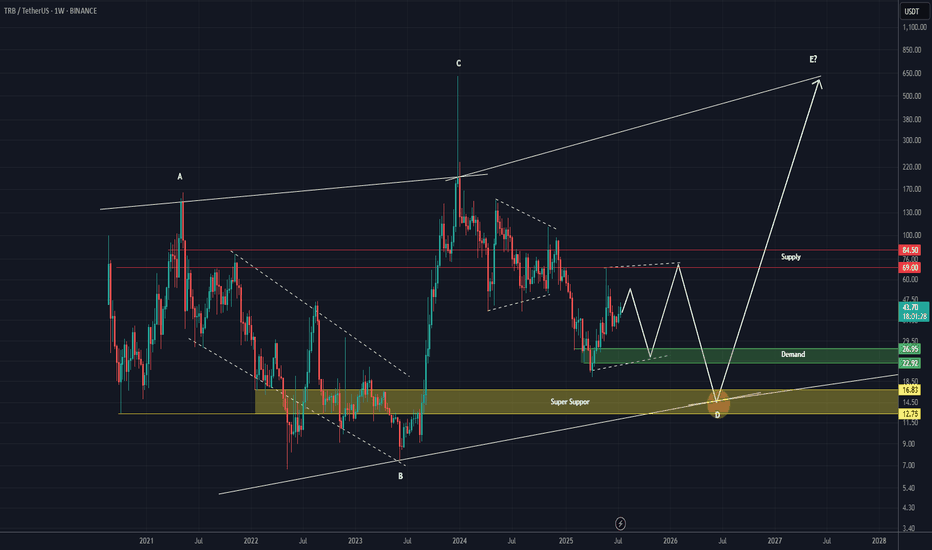
TRB Roadmap (1W)It appears to be within wave D of a larger pattern.
Given the strong rally in wave C, it is expected that this coin will enter a time-consuming correction, so considering a symmetrical pattern for wave D is not illogical.
A short-term upward swing is expected from the green zone.
However, the main buy zone is the yellow box, where wave D could end and wave E may begin.
These moves and this pattern belong to the weekly timeframe and will take time to play out. For a spot buy, it’s best to keep this asset on your watchlist.
For risk management, please don't forget stop loss and capital management
Comment if you have any questions
Thank You


