ICP Is Bearish For MidTerm (3D)On the chart, it appears that we have a large-degree ABC structure, where Wave B formed a triangle and has now completed.
Wave C should take more time than Wave A. Since Wave B has retraced 0.382% of Wave A, it is expected that Wave C will also be deep
We have marked the price and time boxes on the chart.
A daily candle closing above the invalidation level will invalidate this analysis
For risk management, please don't forget stop loss and capital management
Comment if you have any questions
Thank You
Neo Wave

SEI ANALYSIS (1D)SEI appears to be in the C leg of a corrective structure. The correction for this coin is not yet complete in terms of time and price. Wave C is a time-consuming wave, and it is expected to push the price down to the green zone. After reaching this area and accumulating orders, the price is likely to start its move in the form of Wave D.
The targets for the next wave are marked on the chart.
A daily candle closing below the invalidation level will invalidate this analysis
For risk management, please don't forget stop loss and capital management
Comment if you have any questions
Thank You

check the trendThe price is expected to move in the specified direction and after the correction pattern is completed, we will see the start of the upward trend.

WLD looks bearish in the mid-term (1D)It appears that a Wave A lasting 502 days has completed, and a wave of the same degree 502 days (or even larger) is expected to form on the chart, indicating that WLD is bearish in the mid-term.
Over the next 502 days, any pump is expected to be a selling opportunity. To enter a position, a proper trading setup is required.
A daily candle closing above the invalidation level will invalidate this analysis
For risk management, please don't forget stop loss and capital management
Comment if you have any questions
Thank You

check the trendIf the price can break through the support area, the continuation of the downward trend will be likely. Otherwise, by consolidating above the support trend line, the continuation of the upward trend will be possible.

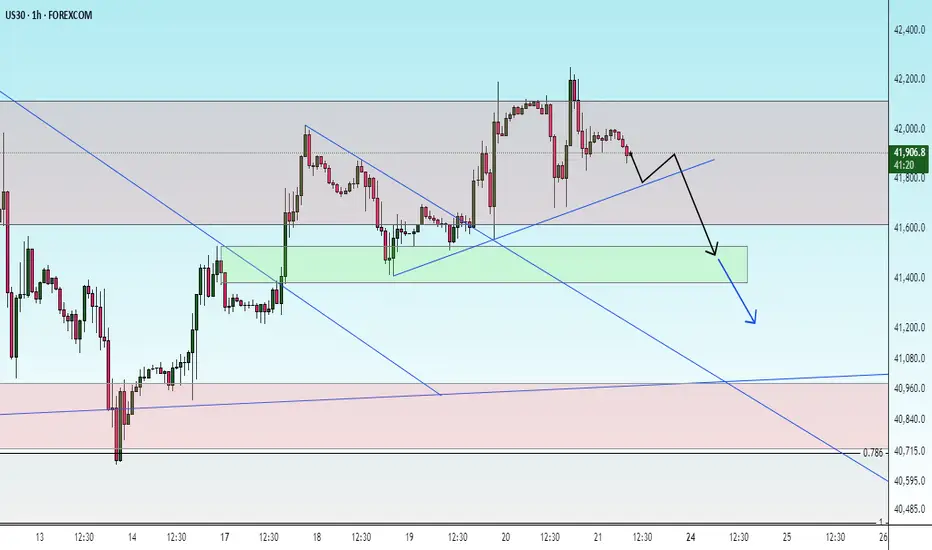
correctionGiven the price behavior in the current resistance area, possible scenarios have been identified.

correctionIt is expected that the downward trend will continue to form until the specified support area. Then the continuation of the movement will proceed according to the specified paths.
It is expected that within the specified time frame, the downward trend will end and the beginning of the upward trend will form.

check the trendConsidering the price behavior in the current resistance level, possible scenarios have been identified. As long as the price fluctuates above the green support level, the continuation of the upward trend is likely.

correctionIt is expected that the downtrend will progress to the specified support level, then it is expected that a trend change will form and we will see the start of an upward trend.

posibility of uptrendIt is expected that within the specified time frame, a trend change will form and we will see the start of an upward trend.

downtrendThe support trend line is expected to be broken, then a continuation of the downtrend is likely. If the index breaks through the previous ceiling range, an upward trend is likely.
downtrendConsidering the price behavior within the current range, a continuation of the downtrend is expected.

correctionConsidering the price behavior within the current support range, possible scenarios have been identified. If the price breaks through the support range, a continuation of the downtrend is likely.

MELANIA Roadmap (4H)It seems that MELANIA is caught in a large bearish Diametric!
A meme coin left to the market!
It appears to be in wave D of this Diametric.
From the supply zone, we expect another rejection toward lower levels.
The closure of a daily candle above the invalidation level will invalidate this analysis.
For risk management, please don't forget stop loss and capital management
Comment if you have any questions
Thank You

CHEEMS ANALYSIS (1D)The correction of this asset has started from the point we marked as "start" on the chart.
It appears to be an ABC correction or a more complex pattern.
It seems that this correction is forming a Flat, and we are currently in wave B of this Flat. Wave B itself is a Diametric, and we are now in wave e of it.
The expected price action of this coin is illustrated on the chart.
The closure of a daily candle above the invalidation level will invalidate this analysis.
For risk management, please don't forget stop loss and capital management
Comment if you have any questions
Thank You

FARTCOIN Is Still Bullish (4H)From the point where we placed the red arrow on the chart, the correction of FartCoin has begun.
This correction appears to be symmetrical and now seems to be complete.
Since a strong bullish wave has not yet formed and the retracement wave is small, it is expected to move from nearby support levels toward the main supply zone.
We are looking for buy/long positions in the demand zone.
A daily candle closing below the invalidation level will invalidate this analysis.
For risk management, please don't forget stop loss and capital management
Comment if you have any questions
Thank You

USDT DOMINANCE NEW UPDATE (8H)This analysis is an update of the analysis you see in the "Related publications" section
From the upper green zone, Wave F of this bullish diametric is expected to complete, leading to Wave G. Wave G is a bullish wave that will likely cause the market to turn red.
Let's see what happens
For risk management, please don't forget stop loss and capital management
Comment if you have any questions
Thank You

RARE Analysis (3D)From the point where we placed the red arrow on the chart, the RARE correction has begun.
It appears that we have a double correction on the chart, and now the second phase of this correction has started.
After the completion of wave X, a supply zone has formed, which seems to act as the price ceiling for RARE.
As long as the red box holds, we expect a downward correction.
A daily candle closing above the invalidation level will invalidate this analysis.
For risk management, please don't forget stop loss and capital management
Comment if you have any questions
Thank You

uptrendThe index is expected to consolidate above the resistance level and then start an uptrend. Otherwise, a continuation of the downtrend to the specified support levels is possible.

possibility of uptrendConsidering the price behavior in the current support range, possible scenarios have been identified. As long as the price fluctuates above the support range, the continuation of the upward trend will be likely.

uptrendIt is expected that we will see the start of the upward trend and the price will advance to the resistance trend line.
If the price breaks through the previous low, the above scenario will be invalid.

correctionThe correction trend is expected to advance to the specified support levels. Then, it is expected that within the specified time frame, a trend change will form and we will see the start of the upward trend.

uptrendIt is expected that we will see the beginning of the uptrend after consolidating above the current support area.
