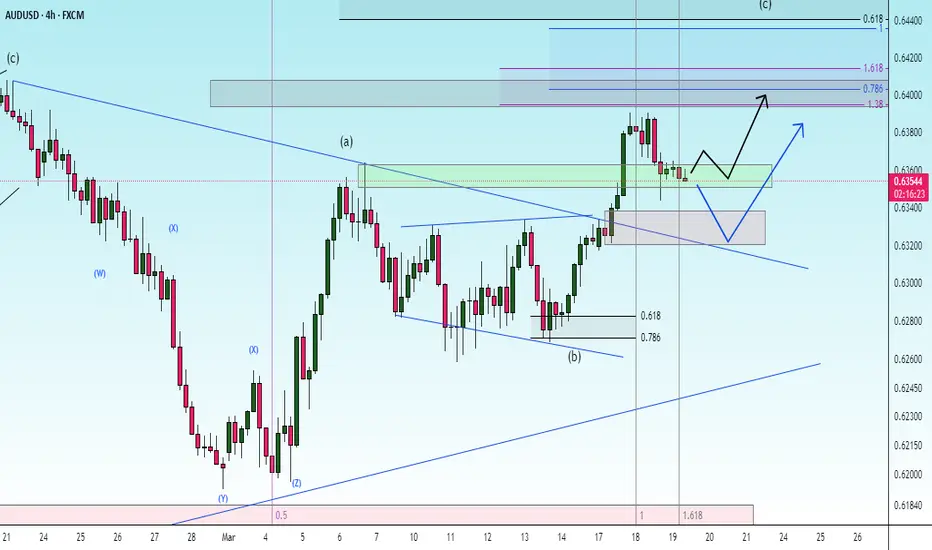
check the trendIt is expected that the trend will change in the green resistance area and we will see the beginning of the downtrend.
If the price consolidates above the resistance area, the upward trend will likely continue.
Neo Wave

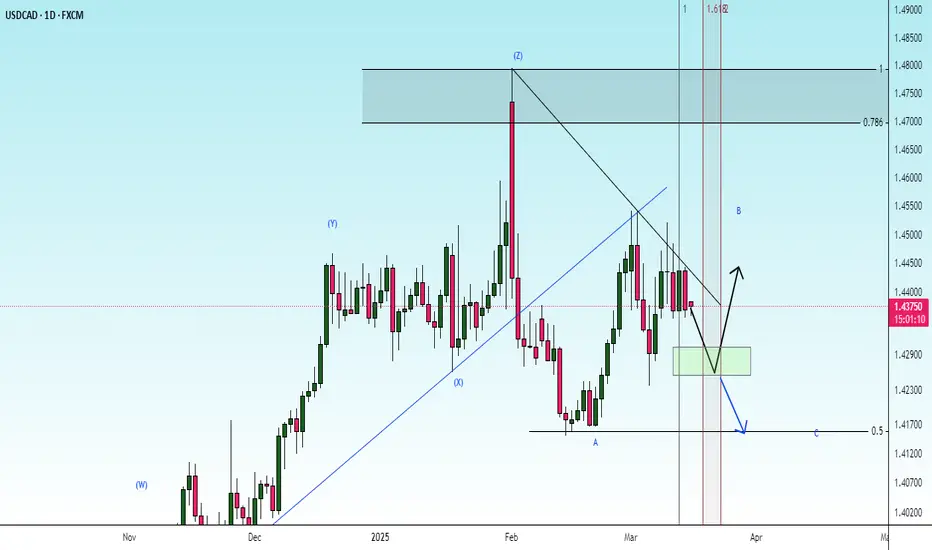
uptrendThe current support range is expected to change the trend and we will witness the start of an uptrend. Otherwise, the continuation of the downtrend to the previous low is possible.

upterndThe uptrend is expected to move along the specified path and advance to the specified resistance levels.

possibility of uptrendIf the price can change the trend within the current support range, the start of an uptrend is possible. Otherwise, the continuation of the correction to the next support range is possible and then there is a possibility of a trend change within this range.
PNUT looks bearish (4H)It appears to be completing a triangle, currently in Wave E.
From the red zone, it may move downward.
Below the chart, there is a liquidity pool, which could be the price target for a sweep.
The invalidation level is slightly far, so proper risk management and position sizing should be maintained
For risk management, please don't forget stop loss and capital management
When we reach the first target, save some profit and then change the stop to entry
Comment if you have any questions
Thank You

TRUMP buy/long setup (4H)It seems that a diametric has completed on the chart. However, Wave G is suspected not to have fully ended yet, and only a part of Wave G might be complete.
A trigger line has been broken, and a support zone has formed, where short-term trades or scalping opportunities can be considered.
As you know, this is a meme coin and carries risk, so make sure to manage leverage and capital properly.
Targets are marked on the chart—secure profits at each target.
The closure of a 4-hour candle below the invalidation level will invalidate this analysis.
For risk management, please don't forget stop loss and capital management
Comment if you have any questions
Thank You

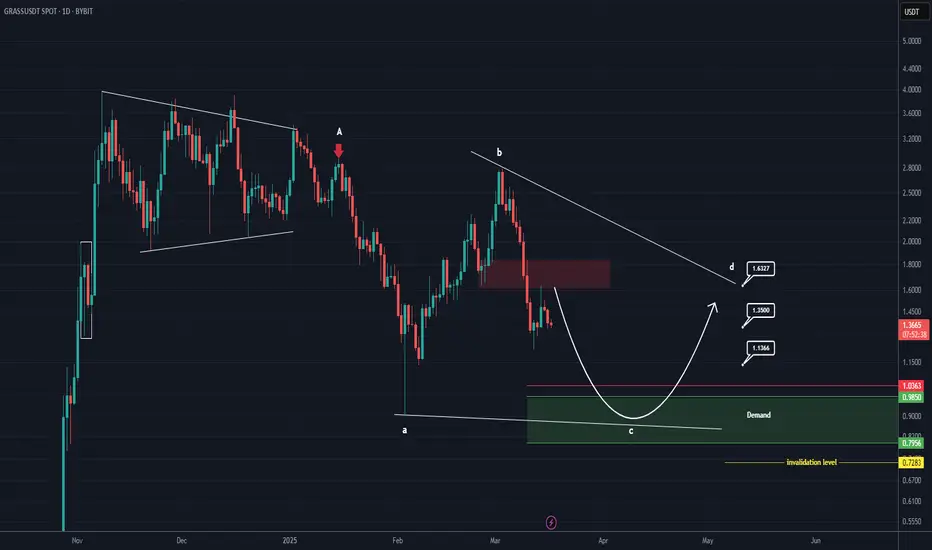
GRASS Analysis (1D)From the point where we placed a red arrow on the chart, it appears that GRASS has entered a corrective phase.
Waves A and B of this correction have completed. It now seems that we are in wave C of this corrective phase.
Wave C is expected to complete within the green zone, leading to the start of wave D.
Wave D is bullish.
The target is marked on the chart.
A daily candle closing below the invalidation level would invalidate this analysis.
For risk management, please don't forget stop loss and capital management
Comment if you have any questions
Thank You
BANANA short setup (4H)BANANA is positioned between an SW H and an SW L. Based on the bases that have formed, it seems that this symbol intends to move toward the targets.
Break even at TP 1.
The closure of a daily candle above the invalidation level will invalidate this analysis.
Do not enter the position without capital management and stop setting
Comment if you have any questions
thank you

VINE is very bearish (12H)Based on the triangle that has recently completed and the pattern of previous fluctuations, it can be analyzed and predicted that this meme coin is in a very bearish diametric pattern.
The D wave has just recently finished, and the price could enter the E wave.
This wave is strong and could reduce the price of this meme coin by more than 60%.
A daily candle closing above the invalidation level would invalidate this analysis.
For risk management, please don't forget stop loss and capital management
Comment if you have any questions
Thank You

possibility of uptrendIt is expected that the price will change trend within the current support range and we will see the beginning of the upward trend. Otherwise, the downward trend will continue to the next support level.

possibility of uptrendIt is expected that after some fluctuation and correction, the upward trend will continue.
If the price breaks through the support range, the correction trend will continue to the specified support levels.

check the terndIt is expected that a trend change will form in the current support range and we will see the start of an upward trend.
correctionIt is expected that after some fluctuation in the current resistance range, we will see the start of a correction trend.
As long as the price fluctuates above the green support range, the upward trend will continue.

uptrendConsidering the price behavior within the current resistance area, possible scenarios have been identified.
The continuation of the upward trend is expected to form and advance to the next resistance areas.

correctionIt is expected that a trend change will form within the current resistance area and we will witness the beginning of the correction.

check the trendThe price is expected to break through the resistance area and the resistance trend line, then the continuation of the upward trend is likely.
If the price breaks through the support levels, the continuation of the downward trend is likely.

downtrendGiven the breakdown of the support range, it is expected that the continuation of the downward trend will form after the pullback to the resistance range.
If the green resistance range is broken, the above scenario will be invalidated.

uptrendIt is expected that a corrective wave will form to the specified support range and then we will see the start of the upward trend.
If the price breaks through the support range and consolidates, the above scenario will be invalidated.

check the trendConsidering the price behavior in the current resistance range, possible scenarios have been identified. As long as the price does not consolidate above the resistance range, the continuation of the downward trend is likely.

Litecoin is in a bearish cycle (12H)From the point where we placed an arrow on the chart, it appears that Litecoin's complex correction has begun.
Currently, we seem to be in wave C of this correction.
Wave C, based on the 3D structure, could end at demand 1, leading to wave D, which is a bullish wave.
However, ultimately, wave E could conclude within the demand 2 zone.
Liquidity pools for waves C and E are marked on the chart, and it is expected that each will be swept in turn.
For risk management, please don't forget stop loss and capital management
Comment if you have any questions
Thank You

IP Looks Bullish (4H)Note: This chart carries its own specific risks. Proper risk management, leverage control, and stop-loss are essential.
It appears that IP is in a bullish dual structure and currently in the second ABC pattern. More precisely, it is in Wave B of this ABC, which is forming a triangle. Currently, we are at Wave E, the final part of the triangle.
If the demand zone holds, the price may move toward the targets.
The closure of a daily candle below the invalidation level will invalidate this analysis.
For risk management, please don't forget stop loss and capital management
Comment if you have any questions
Thank You

uptrendIt is expected that in the current support range, the trend change is expected to see the rise. It can then advance to the specified resistance range.

correctionIt is expected that in the current resistance range, the trend change is expected to see the downtrend start. Then, due to the price behavior in the support level, the continuation of the movement will continue as the routes specified.
