correctionIt is expected that the reform process will be formed up to the specified support scope, then, given the price behavior in the support range, the continuation of the movement will continue as the routes specified.
Neo Wave
uptrendThe high price of the resistance range is expected to consolidate, then the upward trend will be possible.

correctionAfter some fluctuation and correction, the trend is expected to change and continue the downtrend.

uptrendIt is expected that in the current support range, the trend change is expected to see the rise. As long as the high price of the resistance range is not stabilized, the downward trend will probably be possible.

correctionAfter some fluctuation and correction, the trend is expected to change the downtrend. If the resistance range is broken, the upward trend will be possible.


uptrendAfter some correction and fluctuation, the trend is expected to see the start of the uptrend.
If the price crosses the support range, the downward trend will be possible.

Will SOLV pump more? (4H)It seems that a wave A has completed, and wave B has started from the point where we placed the green arrow on the chart.
This wave appears to be a diametric, and we are currently in its wave e.
The red zone is a supply zone that is fresh and untouched. This zone could complete wave e of B, leading us into wave f of B.
A daily candle closing above the invalidation level will invalidate this analysis.
For risk management, please don't forget stop loss and capital management
Comment if you have any questions
Thank You

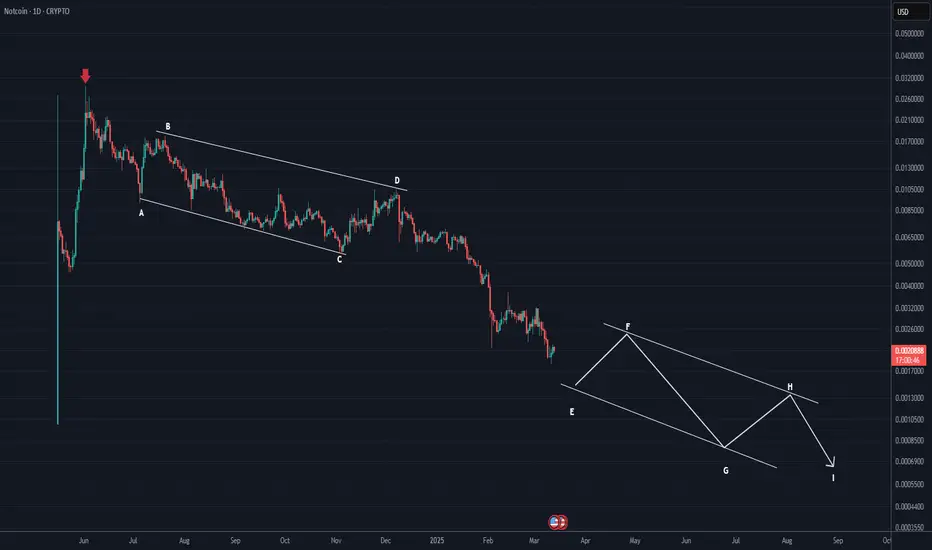
NOTCOIN will remain bearish for a long time (1D)This TON network meme coin seems to have entered a very long correction after its big rally. The correction started from the point where we placed the red arrow on the chart.
The corrective pattern appears to be a large symmetric, and we are currently in its largest wave, which is wave E.
The future path of NOT coin is drawn schematically so you can understand how much time correction and how many waves are left in this pattern.
For risk management, please don't forget stop loss and capital management
Comment if you have any questions
Thank You
Golden Buying Opportunity on ATOM (1W)The correction on ATOM started from the point where we placed the red arrow on the chart.
This correction appears to be either a Diametric or a Symmetrical pattern.
A wave X or wave I to the upside is expected from the Entry levels.
We are looking for buy opportunities in spot at the Entry levels.
A daily candle closing below the invalidation level will invalidate this analysis.
For risk management, please don't forget stop loss and capital management
Comment if you have any questions
Thank You

DUSK ANALYSIS (1W)It seems that after forming the 3D structure, the price has entered a corrective ABC pattern or a more complex one.
It appears that wave B has now ended, and the price has entered wave C.
Wave C has a long correction ahead in terms of time, and in terms of price, the best area for the end of wave C is the green zone.
Let’s wait and see what happens.
For risk management, please don't forget stop loss and capital management
When we reach the first target, save some profit and then change the stop to entry
Comment if you have any questions
Thank You

start the uptrendGiven the behavior of the index within the specified support ranges, possible scenarios have been identified. It is expected that a trend change will take place and we will witness the beginning of an upward trend.

check the trendIt is expected that the upward trend will begin and the price will cross the resistance trend line. Then, with stabilization above the resistance range, the continuation of the upward trend will be likely.

check the trendGiven the price behavior within the current resistance range, it is expected that a trend change will take place and we will witness the start of a downward trend.

possibility of correctionAs long as the price does not stabilize above the resistance range, there is a possibility of a trend change and the start of a correction.

change the trendIt is expected that a trend change will form within the current resistance range and we will witness the beginning of a correction.
If the price breaks through the resistance trend line, the continuation of the upward trend will be likely.

correctionIt is expected that a trend change will form within the current resistance range and we will witness the beginning of a downward trend. If the price consolidates above the resistance range, the above scenario will be invalidated.

correctionIt is expected that a trend change will form within the current resistance range and we will witness the beginning of a downward trend.

change the trendIt is expected that the downtrend will continue after some fluctuations and corrections. As long as the price does not stabilize above the green resistance area, the downtrend will continue.

end of correctionIt is expected that the downtrend has ended within the support trend line and the start of the upward trend is now expected.

possibility of uptrendIt is expected that the trend will change at the specified support levels and we will see the start of the upward trend.

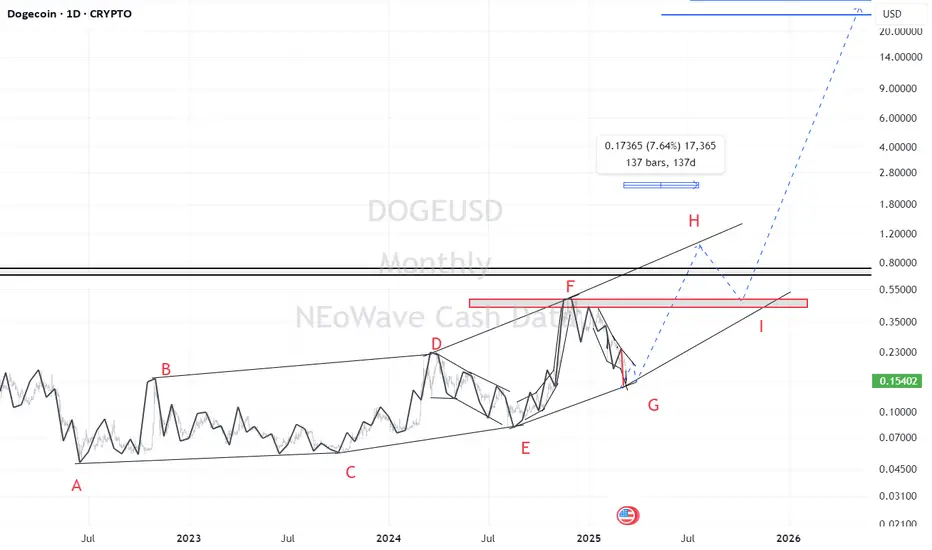
Doge(based on NEo wave)Doge is making a symmetrical which is a boring pattern and it takes too much time!
in about 150 days it will touch 0.90 _ 1 and after that a correction to 0.4_0.5 and after this it will pump too strong.
ETH(based on NEo wave)This supercycle is a nice nature triangle which E wave is ending and its look like a diamon diametrical.
so I will update it for the confirmation, I think ALTseason is so close and we can see that happening soon but this season take about 400 to 450 days and after that there is a huge CRASH!
