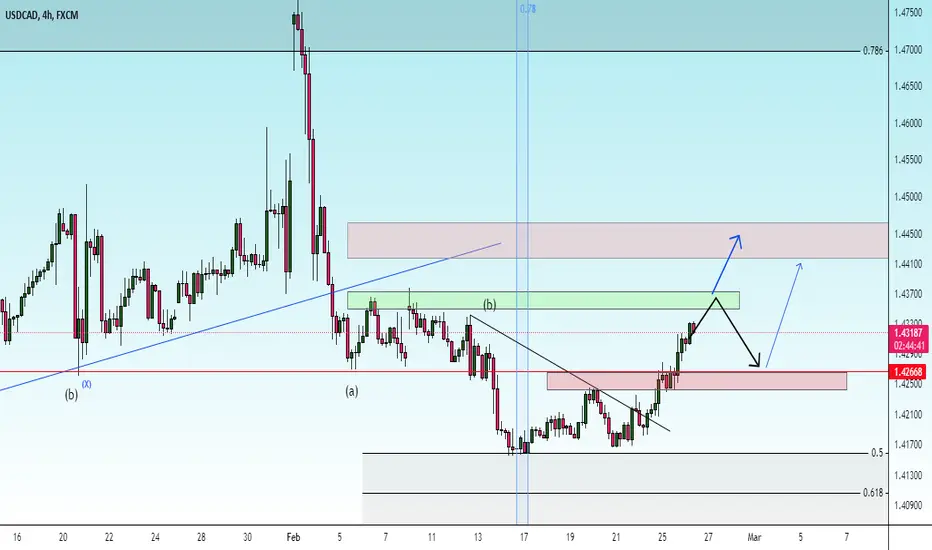
correctionThe upward and fluctuating trend is expected to continue until the specified resistance levels. Then there is a possibility of a trend change.
Neo Wave

Trump New Update (2H)It seems that the TRUMP symbol is forming a Diametric pattern and is currently aiming to complete wave F.
As long as the green zone holds, the price can move toward the red box.
A 4-hour candle close below the invalidation level would invalidate this analysis.
For risk management, please don't forget stop loss and capital management
Comment if you have any questions
Thank You

QNT analysis (12H)The price appears to have completed an ABC pattern and is now in wave D or X. The red zone is where sell/short positions can be considered.
Targets are marked on the chart.
A daily candle closing above the invalidation level will invalidate this analysis.
For risk management, please don't forget stop loss and capital management
Comment if you have any questions
Thank You

JTO analysis (12H)It is one of the altcoins that does not have a clean chart but has a defined range for Sell and Buy.
The larger pattern on the chart appears to be a Diametric, and the price now seems to have entered wave F of this pattern.
In the red-circled area, we are looking for sell/short setups, while in the green zone, we are looking for buy/long positions.
For risk management, please don't forget stop loss and capital management
Comment if you have any questions
Thank You

BTC Update (12H)This analysis is an update of the analysis you see in the "Related publications" section
As you know, the market is trendless and stuck in dumps and pumps, which has made traders frustrated. At this time, we need to follow the indicators and be a bit patient.
Based on the previous analysis, it seems that Bitcoin dominance is heading downward.
Despite Bitcoin’s weak upward movement, some altcoins may have a good upward move in the coming days.
We hope this move happens and this indicator drops. Let's see what happens.
For risk management, please don't forget stop loss and capital management
Comment if you have any questions
Thank You

You won’t believe how bearish ROSE is! (1W)A lot of data is now available on the rising pattern of ROSE. It appears that a large triangle has been completed, which was our wave B.
With the break of the B-D trendline, the triangle is now finished, and we are currently in wave C. Wave C is bearish and should take more time than the large wave A.
ROSE is expected to remain bearish for the next few months, but keep in mind that before the drop, it may pull back to the multi-week supply zone.
Let’s see how it plays out.
For risk management, please don't forget stop loss and capital management
Comment if you have any questions
Thank You

BNB New Update (1W)If you have been following our BNB analyses, you would know that we previously identified its pattern as a triangle.
The price reacted to the green zones from our previous analysis, but based on the weekly candles, it seems that wave E will be deeper.
We are looking for buy opportunities within the green zone, with a minimum target of $800.
This is our current outlook on BNB.
For risk management, please don't forget stop loss and capital management
Comment if you have any questions
Thank You

HMSTR Analysis (1D)HMSTR appears to be forming a diametric pattern, with wave F potentially completing in the red zone.
Wave F is a bullish wave, and the next wave, wave G, is a bearish wave.
To enter a position, create your own trading setup, meaning your entry and stop levels should be clearly defined.
A daily candle closing above the invalidation level will invalidate this analysis.
For risk management, please don't forget stop loss and capital management
Comment if you have any questions
Thank You

NIFTY ..Wedge or Ending diagonal..Excellent spot to buy stocks As you can see the wedge down in the charts is entering a throwdown overshoot..this over shoot can end max up till 21300...This over shoot will trap bears...that confirmation will come when Nifty closes voilently above previous days close...Till then its a downtrend to the above Nifty figure of 21300..So all the best..cause we will have a zoom up up till year end of 11 to 17%

USDT Dominance Update (4H)The large bullish pattern appears to be a symmetrical one, and we are currently in wave I of this structure.
Wave I seems to need a bit more time to complete. The candles are expected to reject from the red zone down to the SS (Static Support) line.
If the candles attack the red zone once again, it could be a good opportunity to buy Bitcoin and altcoins.
Let’s follow the market step by step instead of making predictions. Let’s see what happens.
For risk management, please don't forget stop loss and capital management
Comment if you have any questions
Thank You

Long BTC NOW! Sharp move expected 96K by Feb 27thSharp move upwards expected from BTCUSDT upto 96K.
Close the trade if it hits a new low or if it does not hit 96k by the end of Feb 27th.

The bearish scenario for Ethereum is now active (1D)We have always relied on the flip zone from our previous Ethereum analyses. Now that this zone has been broken, the bearish scenario for Ethereum is active.
A more accurate interpretation suggests that this is the correct structure. Given this, we have been in Ethereum's bearish Wave C for some time.
Ethereum is expected to move from the red zone toward the green zone soon.
For risk management, please don't forget stop loss and capital management
Comment if you have any questions
Thank You

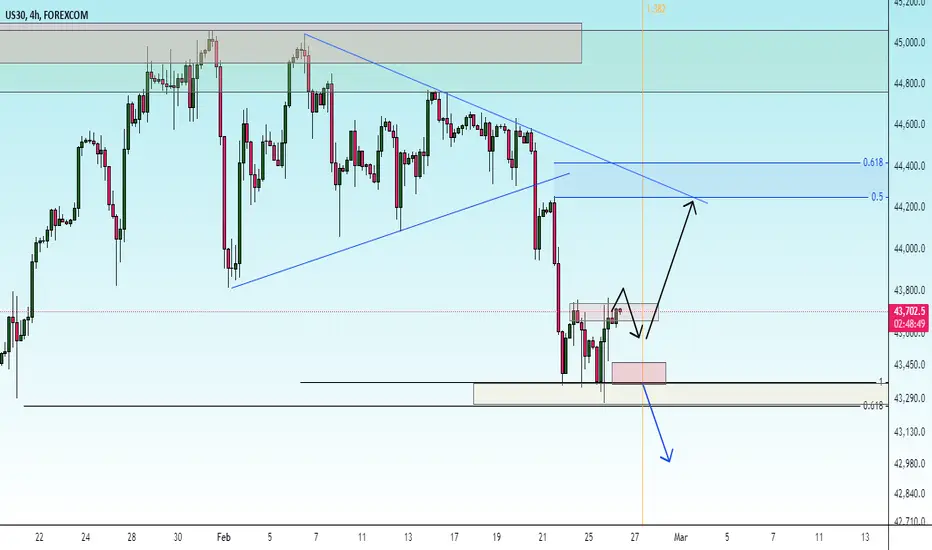
possibility of uptrendConsidering the behavior of the index in the resistance range and the resistance trend line, possible scenarios have been identified. It is expected that we will see the start of an upward trend.

check the trendConsidering the price behavior in the support area and the support trend line, there is a possibility of a trend change and the start of an upward trend.
If the price breaks through the support area, the downward trend is likely to continue.

check the trendConsidering the price behavior in the resistance area, possible scenarios have been identified.
As long as the price fluctuates above the support area, the upward trend is likely to continue.
correctionIt is expected to consolidate above the support area and then see the start of an upward trend. If the price breaks through the support area, the trend may continue to the next support levels.

uptrendThe trend is expected to change in the current support area and we will see the start of the upward trend.
Otherwise, if the support area is broken, the continuation of the downward trend will be likely.

uptrendThe price is expected to consolidate above the current support area and then we will see the continuation of the upward trend.

possibility of uptrendThe price is expected to consolidate above the support area and then we will see the start of the upward trend.
If the price crosses the support area, the continuation of the corrective and fluctuating trend will be likely.

possibility of uptrendThe index is expected to consolidate above the resistance range, then a continuation of the uptrend is likely. If the support range is broken, a continuation of the downtrend and correction is likely.
check the trendConsidering the price behavior within the resistance range, a continuation of the downtrend is likely.
If the price breaks through the resistance range, a continuation of the uptrend to the next resistance levels is possible.

possibility of uptrendConsidering the price behavior within the current support range, possible scenarios have been identified.
The price is expected to consolidate above the support range, then the start of an uptrend is likely.

MYRO ANALYSIS (1D)The correction of MYRO started from the point where we placed the red arrow on the chart.
It is one of the meme coins that has dropped significantly. The pattern of this drop is a large diametric.
The green zone is where the price could push upward to complete wave F.
Targets are marked on the chart.
A daily candle closing below the invalidation level will invalidate this analysis.
For risk management, please don't forget stop loss and capital management
Comment if you have any questions
Thank You
