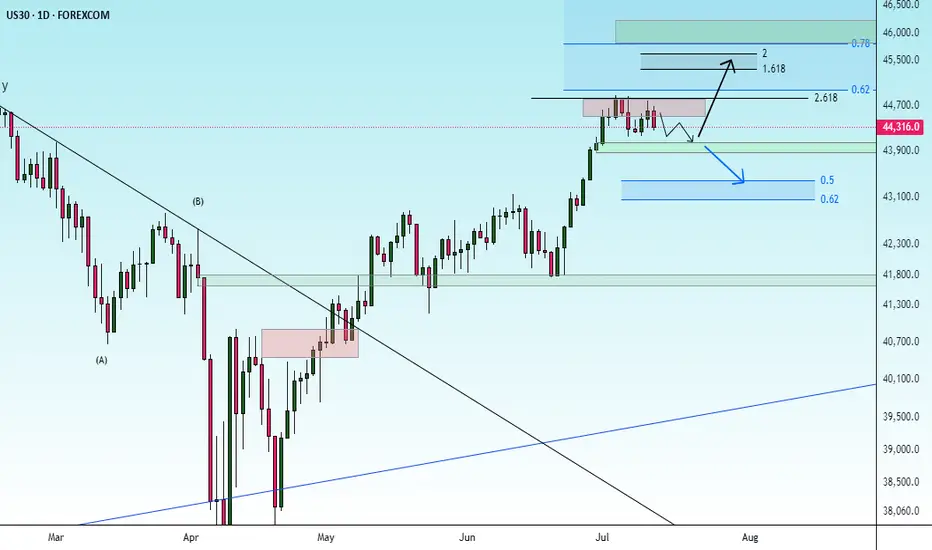
possibility of downtrendIt is expected that the upward trend will advance to the specified resistance range and then we will see a change in trend and the beginning of the downtrend.
If the index crosses the resistance range and consolidates above this range, the continuation of the upward trend will be likely.
Neo Wave

check the trendIt is expected that the upward trend will pass the resistance range and with the stabilization above this range, we will see the continuation of the upward trend.
If the price crosses the support trend line, the continuation of the correction will be formed. And with the failure of the support range, the beginning of the downtrend of the scenario will be likely.

possibility of uptrendConsidering the price behavior in the current resistance range, possible scenarios have been identified. With the resistance range broken and stabilized above, a continuation of the upward trend is likely.

check the trendWith the current support range broken, a continuation of the downward trend to the next support levels is possible. Otherwise, with the support range stabilized above, an upward trend to the specified resistance levels is possible.

check the trendConsidering the price behavior in the current resistance area, possible scenarios have been identified.
If the price breaks through the resistance area, the continuation of the upward trend will be likely. Otherwise, a downward trend is possible with the support trend line broken.

correctionThe correction trend at the support levels and the support trend line is expected to end and then we will see the start of the upward trend. Otherwise, the continuation of the downward trend with the breakdown of the support area will be possible.

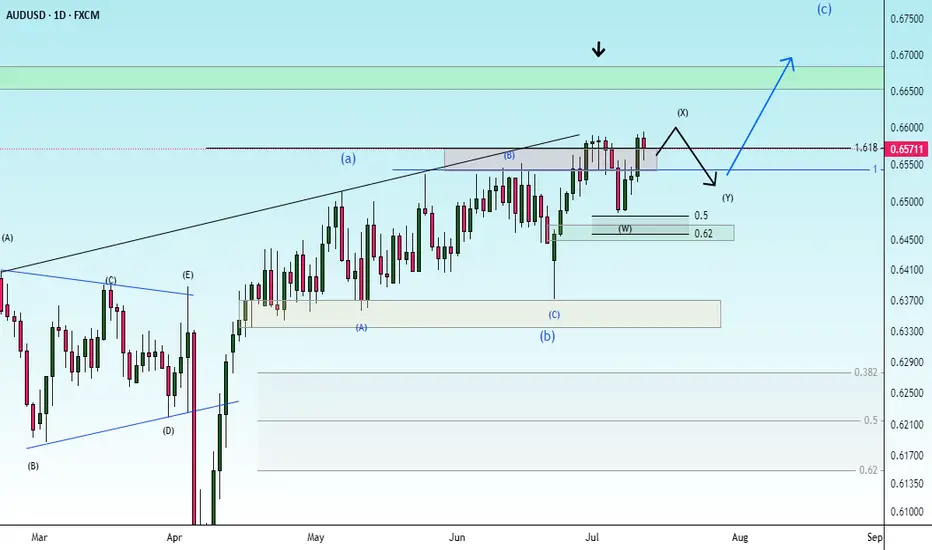
possibility of uptrendThe price is expected to break through the resistance area and continue the upward trend according to the specified path.
If there is strength in the upward trend, a c wave can be drawn.

correctionIt is expected to fluctuate within the current support level and then continue the upward trend.
If the index breaks through the green support level, the correction to the next support level is possible.
uptrendThe upward trend is expected to advance to the specified resistance level. Then, there is a possibility of a trend change and the correction will begin.

possibility of uptrendThe correction is expected to move in the specified direction and the correction pattern is completed. Then, we are expected to see the start of the upward trend.
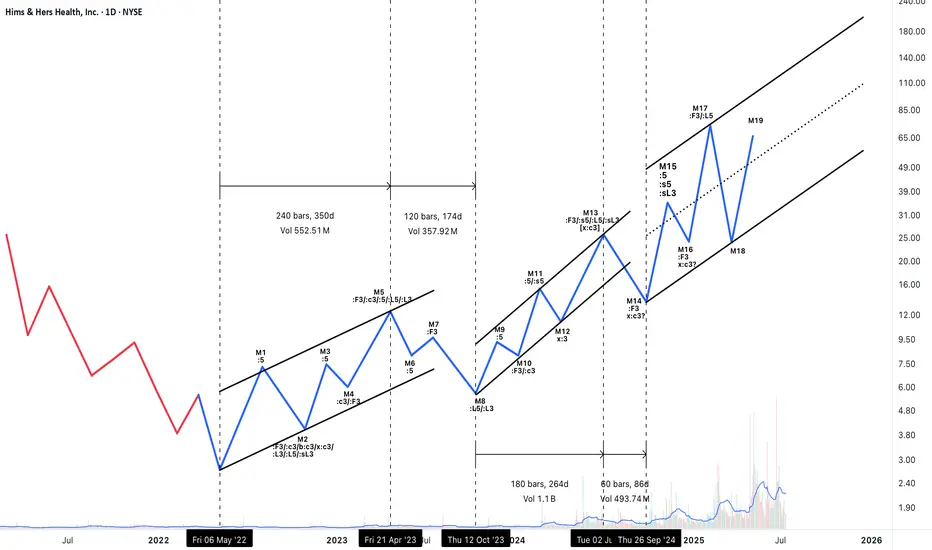
Neowave Structural Outlook – Complex Correction: W–X–Y–X–ZThis analysis interprets the ongoing structure as a Complex Correction in the form of a W–X–Y–X–Z pattern. Here's a breakdown of the logic behind the wave labeling and key observations:
Overall Structural Summary:
W wave (M1–M5): Though M1 is labeled as ":5", a closer examination of its internal structure reveals corrective characteristics. Therefore, the entire M1–M5 segment is best interpreted as a complex corrective structure, possibly a double three or flat.
X wave 1 (M6–M8): A clear Zigzag, fulfilling the requirements for a valid X. All relevant time and price criteria are met, forming a neat connector after W.
Y wave (M9–M13):
M9–M10: A Zigzag formation.
M11–M12–M13: M12 serves as an x-wave, and M13 unfolds as a simple corrective move in three waves, completing the Y wave. Though M13 is a single-leg visually, the internal structure confirms a three-part move.
The Y wave is longer in both time and complexity, appropriate for its position in the sequence.
X wave 2 (M14): Despite appearing as a short single move, it satisfies the X criteria in the context of the ongoing correction. The small size is acceptable as per rule allowances for connectors in Z formations.
Z wave (M15–ongoing):
M15–M17: Another Zigzag, forming the first leg of Z.
M18: Likely the X connector within Z.
M19: Assumed to be the beginning of the final leg of Z. The structure from here forward will determine whether Z completes as a triangle, zigzag, or another combination.
Supporting Rule Applications:
Several Neowave rules were cross-verified:
- Rule 2a and 5a were referenced to validate corrections that exceed the 61.8% retracement and duration benchmarks.
- Rule 7c and 4 supported impulse invalidations and corrections involving running structures.
Time symmetry across connectors and leg duration was considered to maintain wave consistency.
Visual Channels:
All W, Y, and Z legs are progressing within clearly defined channels.
The Z leg is currently within a steep rising channel. If Z completes as a non-triangular formation, a reversal might follow.
Conclusion & Risk Notes:
This structure, though corrective in nature, contains strong upward segments — especially within Z — making it tradable for bullish swings.
Given that Z is the final leg, caution is warranted. Once Z completes (especially if M19 develops into a three-wave structure), the larger correction may terminate, potentially leading to a larger trend reversal.
Position management (e.g., scaling out or using stop-losses) is advised as the structure evolves.
ZRX Looks Bullish (2D)From the point where we placed the red arrow on the chart, it appears that a triangle is forming.
Now, considering the formation of a double bottom at the low and the break of the bearish trendline, it seems that the price is ready to complete wave E of this triangle.
As long as the new demand zone holds, the bullish move can continue.
The targets are marked on the chart.
A daily candle closing below the invalidation level will invalidate this analysis.
For risk management, please don't forget stop loss and capital management
When we reach the first target, save some profit and then change the stop to entry
Comment if you have any questions
Thank You

Are we on Super Bullish Express Highway ? Elliott Waves RoadmapHello friends,
Welcome to RK_Chaarts
Today we're attempting to analyze Bitcoin's chart, specifically the BTCUSD chart, from an Elliott Wave perspective. Looking at the monthly timeframe chart, which spans the entire lifetime of Bitcoin's data since 2011, we can see the overall structure. According to Elliott Wave theory, it appears that a large Super Cycle degree Wave (I) has completed, followed by a correction in the form of Super Cycle degree Wave (II), marked in blue.
Now, friends, it's possible that we're unfolding Super Cycle degree Wave (III), which should have five sub-divisions - in red I, II, III, IV, & V. We can see that we've completed red I & II, and red III has just started. If the low we marked in red II doesn't get breached on the lower side, it can be considered our invalidation level.
Next, within red III, we should see five primary degree sub-divisions in black - ((1)), ((2)), ((3)), ((4)) & ((5)). We can see that we've completed black ((1)) & ((2)) and black ((3)) has just started. Within black ((3)), we should see five intermediate degree sub-divisions in blue - (1) to (5). Blue (1) has just started, and within blue one, we've already seen red 1 & 2 completed, and red 3 is in progress.
So, we're currently in a super bullish scenario, a third of a third of a third. Yes, the chart looks extremely bullish. We won't commit to any targets here as this is for educational purposes only. The analysis suggests potential targets could be very high, above $150,000 or $200,000, if the invalidation level of $98,240 isn't breached. But again, friends, this video is shared for educational purposes only.
Many people think that the market doesn't move according to Elliott Waves. But friends, here we've tried to analyze from the monthly time frame to the overly time frame. We've definitely aligned the multi-time frame and also aligned it with the principal rules of Elliott Waves, without violating any of its rules.
I agree that the Elliott Wave theory can be a bit difficult, and for those who don't practice it deeply, it can be challenging. But yes, the market moves according to this methodology, following this pattern. This is a significant achievement.
I am not Sebi registered analyst.
My studies are for educational purpose only.
Please Consult your financial advisor before trading or investing.
I am not responsible for any kinds of your profits and your losses.
Most investors treat trading as a hobby because they have a full-time job doing something else.
However, If you treat trading like a business, it will pay you like a business.
If you treat like a hobby, hobbies don't pay, they cost you...!
Hope this post is helpful to community
Thanks
RK💕
Disclaimer and Risk Warning.
The analysis and discussion provided on in.tradingview.com is intended for educational purposes only and should not be relied upon for trading decisions. RK_Chaarts is not an investment adviser and the information provided here should not be taken as professional investment advice. Before buying or selling any investments, securities, or precious metals, it is recommended that you conduct your own due diligence. RK_Chaarts does not share in your profits and will not take responsibility for any losses you may incur. So Please Consult your financial advisor before trading or investing.

AI Looks Bullish (12H)The AI correction has started from the point marked as "start" on the chart.
It seems that wave C has completed, as its time cycle has finished and the price has reclaimed key levels.
As long as the green zone holds, the price can move toward the targets and the red box.
The targets are marked on the chart.
A daily candle closing below the invalidation level will invalidate this analysis.
For risk management, please don't forget stop loss and capital management
Comment if you have any questions
Thank You

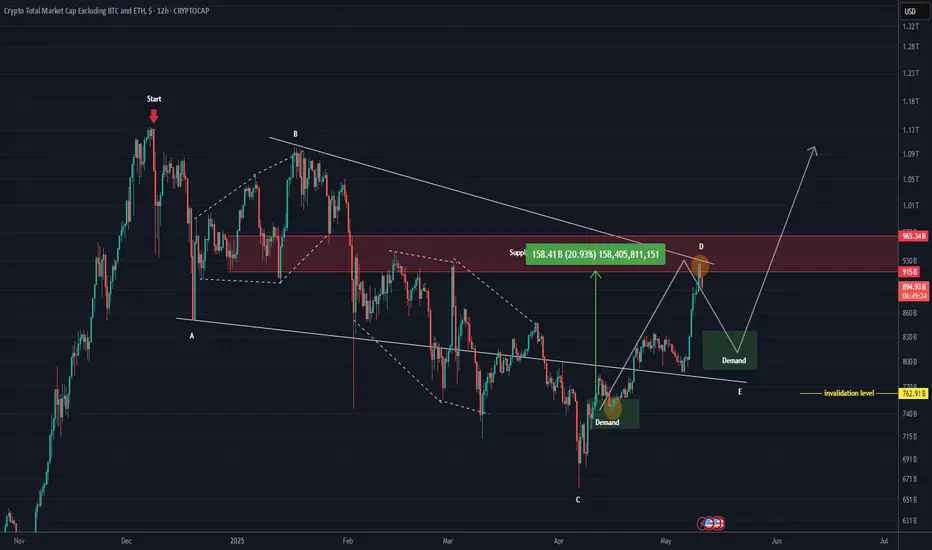
TOTAL 3 New Update (12H)This analysis is an update of the analysis you see in the "Related publications" section
TOTAL3 refers to the total crypto market cap excluding Bitcoin and Ethereum.
It pumped from the lower demand zone to the marked red box and has surged by 21%.
We now need a retracement to make the price more attractive.
If the invalidation level and the green zone hold, we could witness another bullish wave.
In this analysis, the invalidation level has been updated. A daily candle closing below this level will invalidate the setup.
Some altcoins are currently bullish, and each chart must be analyzed individually| so be cautious with your short positions.
For risk management, please don't forget stop loss and capital management
Comment if you have any questions
Thank You
ARB New Analysis (3D)Before anything else, pay attention to the timeframe | it's a higher timeframe and will take time.
The higher timeframe structure of ARB is honestly not that bullish. In this scenario, we’ve considered the entire correction | starting from where the red arrow is placed on the chart | as a diametric/symmetrical pattern.
From a time perspective, wave E has not yet completed, and it is expected to finish somewhere between the two vertical lines. Wave E here is a bearish wave.
If the price pulls back and reaches the green box, we can look for a buy setup in that area.
A 3-day candle closing below the invalidation level will invalidate this analysis.
For risk management, please don't forget stop loss and capital management
When we reach the first target, save some profit and then change the stop to entry
Comment if you have any questions
Thank You

ETH New Analysis (12H)This analysis is an update of the analysis you see in the "Related publications" section
The previous analysis is still valid | its timeframe is higher, but in this update, we've moved to the lower timeframes.
It seems a valid bottom has been formed on Ethereum, and we may not see a lower low, provided that the price doesn't move higher first but instead drops directly into our support zone. If that happens, the price could potentially move upward from there.
Ethereum seems to be searching for a support zone to reach higher levels. The marked area could potentially launch the price upward.
In this analysis, the support zone, targets, and invalidation level have been updated.
For risk management, please don't forget stop loss and capital management
When we reach the first target, save some profit and then change the stop to entry
Comment if you have any questions
Thank You

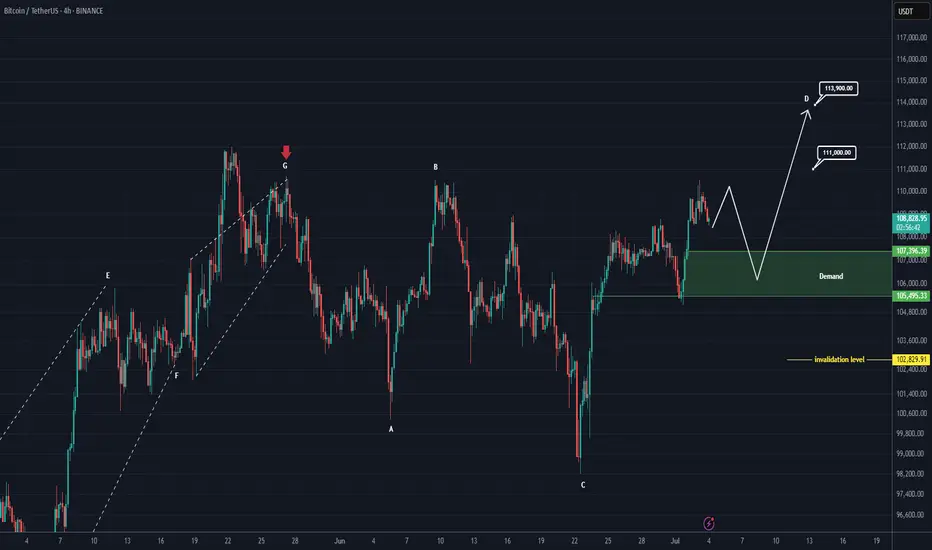
Bitcoin New Update (4H)This analysis is an update of the analysis you see in the "Related publications" section
If we were to publish an update for Bitcoin, wave D could move toward higher levels.
After hitting the green zone and gaining momentum, it could once again move upward to liquidate short positions.
In this update, we've naturally raised and revised the invalidation level.
The new targets have been marked on the chart.
A daily candle closing below the invalidation level would invalidate this analysis.
For risk management, please don't forget stop loss and capital management
Comment if you have any questions
Thank You
possibility of uptrendThe bullish pattern is expected to advance along the specified path to the specified resistance levels. Then there is a possibility of a trend change.
If the support area is broken, the continuation of the downward trend is likely.

check the trendConsidering the price behavior within the current support range, possible scenarios have been identified. It is expected that a trend change will form within the current support range and we will witness the start of an upward trend.
Otherwise, the continuation of the downward trend to the next support levels is possible.

uptrendIt is expected that after some fluctuation and correction, the upward trend will continue. A break and consolidation above the resistance trend line will be a confirmation of the upward trend.
Otherwise, a continuation of the downward trend with a break of the green support range will be possible.

check the trendIt is expected that a trend change will form within the current support range and we will witness the start of an upward trend.
If the price breaks through the support range, a continuation of the downward trend will be likely.
possibility of uptrendAs long as the price is above the green support range, the continuation of the upward trend is likely. Upon reaching the 100% level, a correction trend will probably form.
