BTC ANALYSIS (4H)Last week, Bitcoin made a sharp bullish move upward, aiming for retail liquidity, which made the forecast path more difficult.
The green zone is a support area where Bitcoin might react.
To collect the ATH liquidity, Bitcoin needs to break through the red zone.
Let’s see what happens | when the market direction isn’t clear, there’s no need to take unnecessary risks.
For risk management, please don't forget stop loss and capital management
Comment if you have any questions
Thank You
Neo Wave

BABA Stock: A Detailed Analysis using Elliott Wave Theory RulesHello Friends,
Welcome to RK_Chaarts,
Let's analyze Ali Baba Group Holdings Limited, also known as BABA, listed on the NYSE. We'll be using the Elliott Waves theory.
Friends, as we can clearly see, after hitting a low of around $95.75 on 9th April 2025, it started an impulse wave. Within this wave, we've completed intermediate degree blue bracketed (1), (2), (3), (4), (5), and primary degree ((1)) in Black. Currently, we're completing primary degree ((2)), with a low around $111.
If it breaks the level of $111, we'll assume we're still in primary degree ((2)), as marked in scenario 2 on the chart. This means wave ((2)) is unfolding, and wave ((3)) might start after wave ((2)) is complete.
If it doesn't break the $111 level, it's likely that wave ((2)) has completed, and we've started a subdivision of wave ((3)) or its further subdivisions. If it moves further up, following scenario 1 (the black line on the chart), this is a possibility.
According to Elliott Wave theory, wave ((2)) cannot retrace more than 100% of wave ((1)). So, our main invalidation level for this count is $95.75. Yes, BABA is turning up against the 95.75 low, and in the near term, we expect the stock to trade higher.
Somewhere, this stock might move towards $150 or $160 if it doesn't break down below $ 95.75.
I am not Sebi registered analyst.
My studies are for educational purpose only.
Please Consult your financial advisor before trading or investing.
I am not responsible for any kinds of your profits and your losses.
Most investors treat trading as a hobby because they have a full-time job doing something else.
However, If you treat trading like a business, it will pay you like a business.
If you treat like a hobby, hobbies don't pay, they cost you...!
Hope this post is helpful to community
Thanks
RK💕
Disclaimer and Risk Warning.
The analysis and discussion provided on in.tradingview.com is intended for educational purposes only and should not be relied upon for trading decisions. RK_Chaarts is not an investment adviser and the information provided here should not be taken as professional investment advice. Before buying or selling any investments, securities, or precious metals, it is recommended that you conduct your own due diligence. RK_Chaarts does not share in your profits and will not take responsibility for any losses you may incur. So Please Consult your financial advisor before trading or investing.

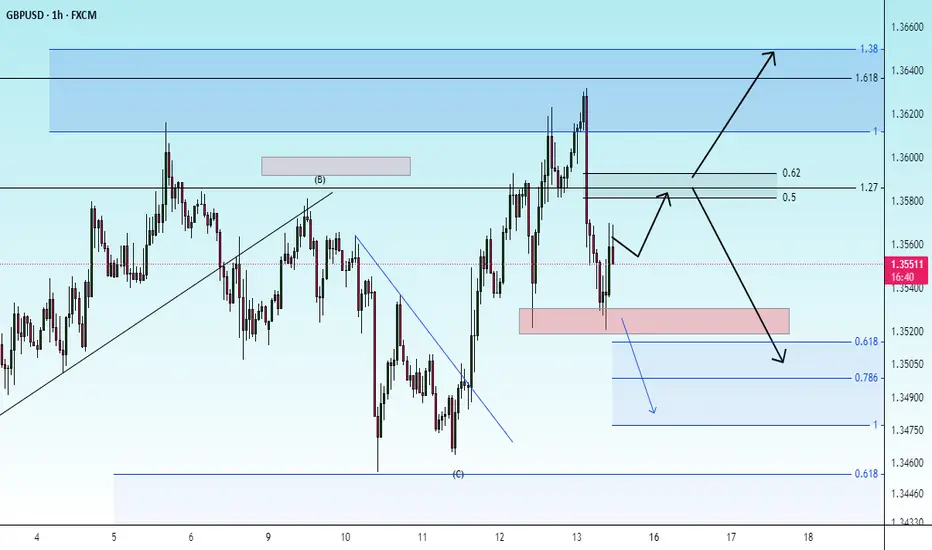
check the trendIt is expected that the correction trend will form up to the specified support zone, then there will be a possibility of a trend change. With the failure of the green resistance zone, confirmation of the bullish trend will be formed.

check the trendIt is expected that the corrective trend will move according to the specified direction and continue to the specified Fibonacci levels. Then a continuation of the upward trend will be possible.
A consolidation above the green resistance zone will confirm the bullish trend.

possibility of uptrendIt is expected that a trend change will form within the current support area and we will witness the beginning of the upward trend. If the price breaks through the support area, a continuation of the downward trend to the next support area is possible.

check the trendThe upward trend is expected to continue to the specified resistance levels. Then there is a possibility of a trend change.
If the price breaks through the support area, a continuation of the downward trend to the specified support levels is possible.
possibility of correctionIt is expected that a trend change will take place in the current resistance range and we will witness the beginning of a downward trend. If the price consolidates above the resistance range, the continuation of the upward trend is likely.

possibility of correctionConsidering the price behavior in the current support range, there is a possibility of an upward trend. Otherwise, the continuation, with the support range broken, of a continuation of the downward trend is likely.

correctionConsidering the price behavior in the current support range, possible scenarios have been identified.
The possibility of a continuation of the downward trend to the green support range is possible.

possibility of correctionAs long as the indicator below the green resistance range fluctuates, the continuation of the correction trend will be likely. With the consolidation above the resistance range, the continuation of the upward trend will be likely.

check the trendIt is expected that the upward trend will advance to the specified resistance range. Then there will be a possibility of a trend change. If the price crosses the resistance range, the continuation of the upward trend will be likely.

correctionIt is expected that after some fluctuation and rise, a trend change will form in the specified resistance range and we will see the continuation of the downward trend.

Where is Ethereum's target? (1D)This analysis is an update of the analysis you see in the "Related publications" section
The previous analysis has expired, and the price moved up without any correction. This type of movement is usually intended to attract liquidity, and once liquidity is absorbed, the price often goes through a correction.
From the point where we placed the green arrow, Ethereum has entered a bullish phase.
It now appears that we are in wave B of this bullish phase. The price may get rejected from the red zone.
Price can be rejected from the red box.
Do not enter any positions without confirmation, as the price may even continue moving up to the top of the red box.
For risk management, please don't forget stop loss and capital management
When we reach the first target, save some profit and then change the stop to entry
Comment if you have any questions
Thank You

BTC.D(based one NEowave)the Z wave of this branch shown as a triangle and I think its finished but for confirmation breaking the 61.9 is important.
its a green light of Altseason.

Will Bitcoin move toward its ATH?This analysis is an update of the analysis you see in the "Related publications" section
In the previous analysis, we mentioned that the red zone marked on the chart could potentially be broken.
From the point where we placed the green arrow on the chart, Bitcoin’s diametric pattern has completed, and it has entered a corrective phase.
It now appears that we are in wave B of a running flat, and wave B could complete around the all-time high or slightly above it.
Let’s see whether this move will play out or not.
For risk management, please don't forget stop loss and capital management
Comment if you have any questions
Thank You

Possibility of uptrend It is expected that after some fluctuation and correction in the support area, a trend change will take place and we will witness the start of an upward trend. A break of the green resistance area will be a confirmation of the upward trend. Otherwise, the continuation of the corrective trend to the support areas will be possible.

Check the trend It is expected that a trend change will occur at the current resistance level and we will see a continuation of the downtrend. If the price breaks through the resistance level and consolidates above the resistance level, a continuation of the uptrend is likely.

Check the trend A trend change is expected to form within the current support area and we will see the start of an uptrend. A consolidation above the blue trend line will confirm the uptrend.

Correction The recent downtrend could end within the specified support levels and we could see the start of an uptrend. If the price breaks through the 100% level, a continuation of the downtrend is likely.

Possibility of uptrend It is expected that after some fluctuation, the upward trend will start and will advance to the previous ceiling. In this case, the continuation of the upward trend will be likely. If the price breaks through the support area, the continuation of the downward trend and correction will be possible.

Possibility of uptrend It is expected that after some fluctuations and corrections within the current range, the continuation of the upward trend will take place. Confirmation of the upward trend will be the consolidation of the price above the resistance range. Otherwise, the continuation of the downward trend to the specified support ranges will be possible.

Possibility of uptrend The price is expected to consolidate above the current resistance level and then continue its upward trend. Otherwise, a correction to the indicated support level is possible.

Upward trend After some fluctuation and correction to the specified support level, there is a possibility of a trend change. Then the start of an uptrend is likely. Otherwise, if the support level is broken, the downtrend may continue to the next support level.
