Doge(based on NEowave)like ETH wave E is ending and soon it will start a huge bullish wave.
wave E look likes a bow-tie diametrical and wave g is at the end which is the last chance to buy.
Neo Wave

USDT.D(based on NEowave)I think wave E of triangle touched the necessary high and crypto is ready for a big pump.
pay attention to the targets and stop loss!

check the trendThe downtrend is expected to end at the current support level and an uptrend will begin. Otherwise, if the support level is broken, the downtrend could continue to the next support level.
check the trendIt is expected that the corrective trend will end in the current support area and we will see the beginning of the upward trend. If the price crosses the support area, the continuation of the downward trend will be likely.
check the trendIt is expected that the price will consolidate above the resistance area, then the continuation of the upward trend will be possible. Otherwise, the corrective and downward trend will continue.
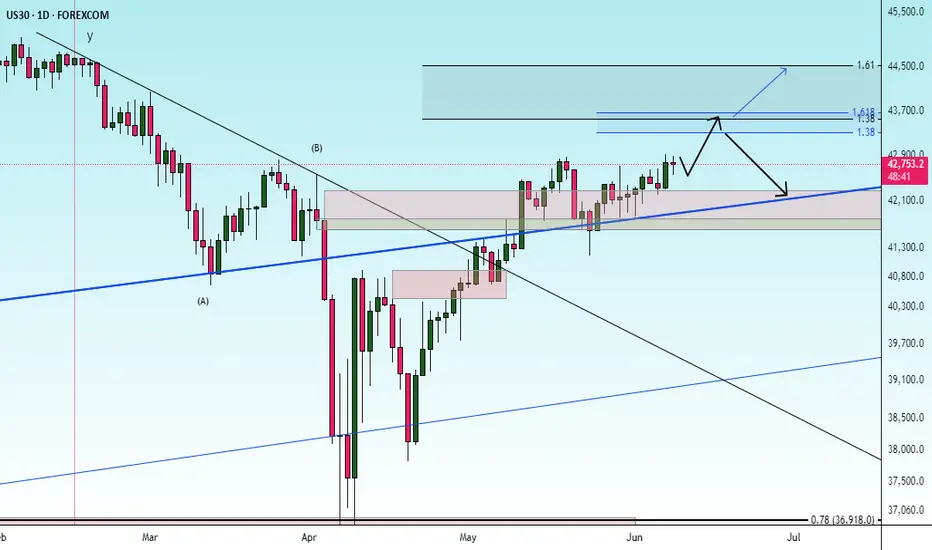
Correction and then uptrendIt is expected that after some fluctuations and corrections, the upward trend will continue.
If the price breaks through the support area, the downward trend will continue.
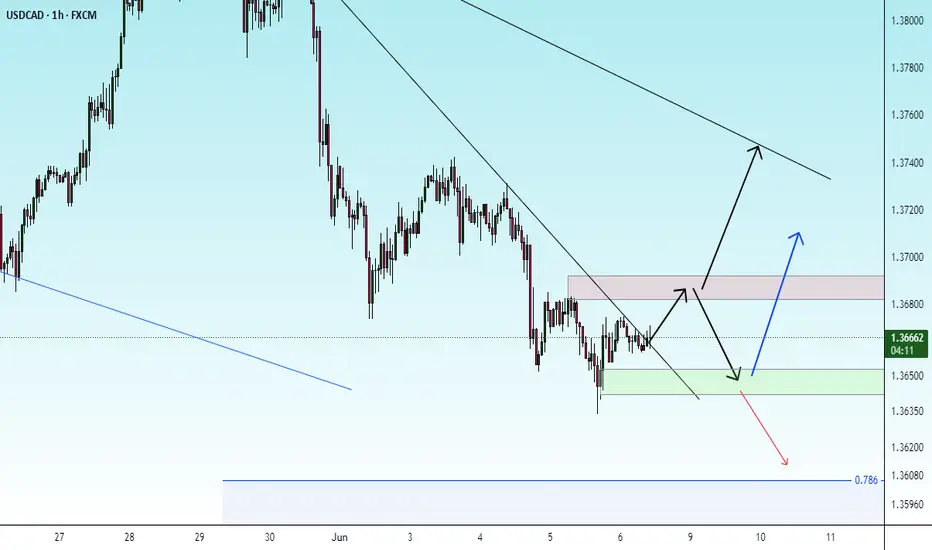
possibility of uptrendIt is expected that a corrective trend will form to the specified support levels. Then there is a possibility of a trend change and the upward trend will continue.
If the price breaks through the support range, the continuation of the downward trend will be likely.

possibility of uptrendIt is expected that the upward trend will continue to the specified resistance levels.
If the price can break through the support range, the continuation of the downward trend will be likely.

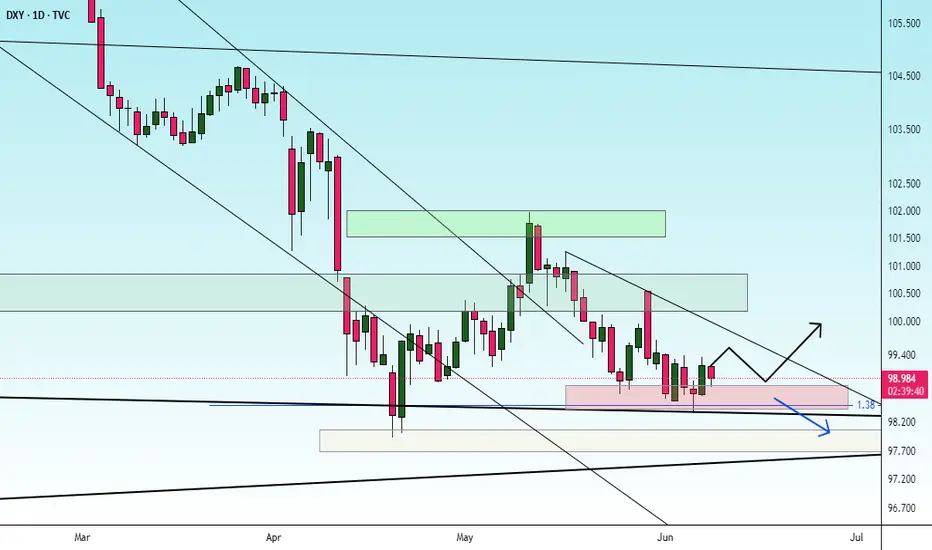
possibility of uptrendIt is expected that a trend change will form within the current support range and we will witness the start of an upward trend. A break and consolidation above the resistance range will be confirmation of the upward trend.

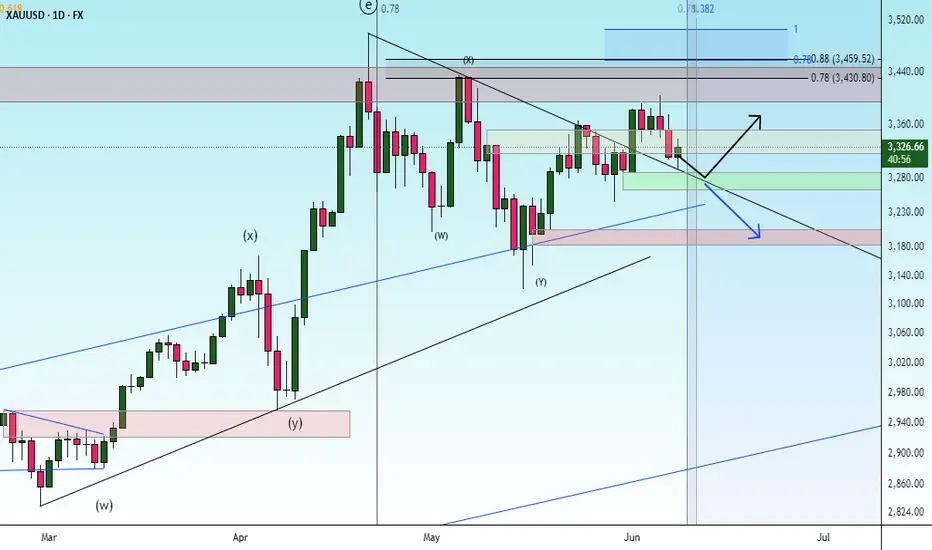
possibility of uptrendThe uptrend is expected to progress to the specified resistance level. Then there is a possibility of a trend change.
A break of the green support level will cause a correction and fluctuation.
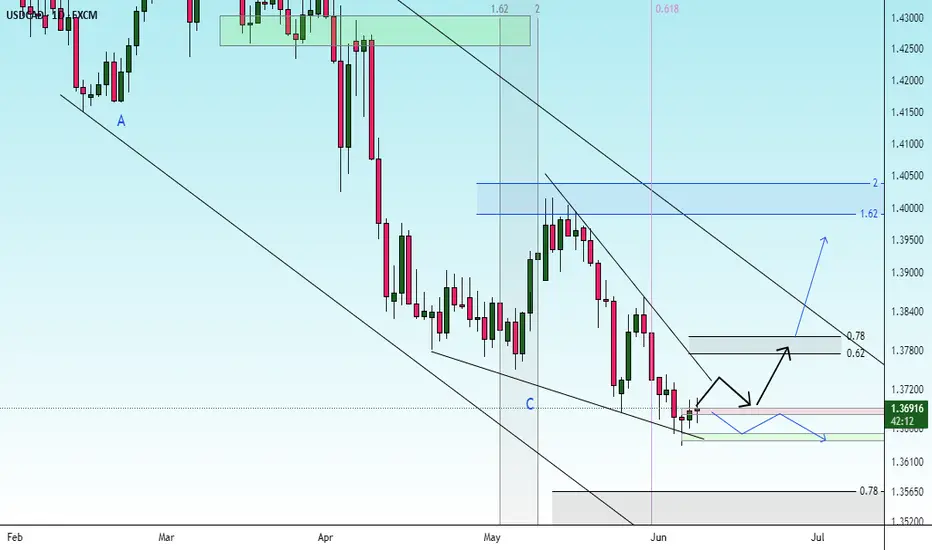
uptrendThe correction is expected to eventually progress to the specified support level, then an upward trend is likely.
If the price breaks through the support level, a continuation of the downward trend to the next support level is possible.

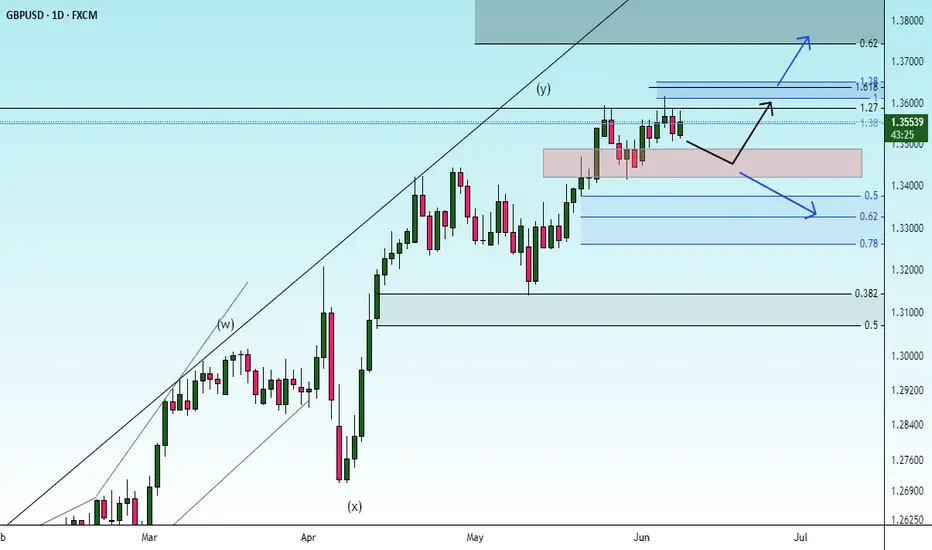
uptrendThe price is expected to rise to the specified resistance level. Then there is a possibility of a trend change.
If the price consolidates above the resistance level, a continuation of the upward trend is likely.

ETH New Update (4H)After being rejected from the higher levels and losing the trigger line, Ethereum now appears to have pulled back into the range zone and the trigger line.
It is expected that the price will be rejected once again from the red zone to the downside, and then turn bullish again from one of the two green zones and move upward.
This is our current outlook on Ethereum. The analysis will be updated accordingly.
Keep in mind that taking short positions in these zones is not low-risk either!
For risk management, please don't forget stop loss and capital management
Comment if you have any questions
Thank You

USDT DOMINANCE Update (4H)In our latest analysis, we pointed out the bullish movement in Tether dominance and warned to be cautious | and eventually, that move played out.
The bullish movement in Tether dominance started from the point where we placed the green arrow on the chart. It appears to be an ABC pattern, and we are currently in wave C.
Now, after the drop, the price is approaching a support zone that could potentially push it back to higher levels, so we need to stay alert.
The bullish wave C could complete in one of the marked zones.
Let’s see what happens.
For risk management, please don't forget stop loss and capital management
When we reach the first target, save some profit and then change the stop to entry
Comment if you have any questions
Thank You

uptrendThe triangle pattern is expected to continue along the specified paths. Then, with the completion of the corrective pattern, the start of an upward trend is likely.

correctionIt is expected that the correction trend will form to the specified support area. Then, there will be a possibility of a trend change. If the price crosses the red support area, the continuation of the downward trend to the support trend line area will be possible.

possibility of uptrendThe price is expected to cross the resistance trend line and advance to the specified resistance area. Then, considering the price behavior in the resistance area, possible scenarios have been identified.
check the trendWith the support trend line break, the continuation of the downward trend will be likely. Then, considering the price behavior in the specified support area, there is a possibility of a trend change and the start of an upward trend.

check the trendIt is expected that a trend change will form within the current support line, then there is a possibility of a trend change and the start of an uptrend. The support area break will cause the continuation of the downward trend.

correctionIt is expected that we will see price fluctuation within the current support line, then there is a possibility of a trend change and the start of an uptrend. If the price breaks through the support line, the downtrend will continue to the next support line.

possibility of uptrendIt is expected that a trend change will form within the current support line and we will see the start of an uptrend. If the price breaks through the support line, the downtrend will continue.

uptrendThe trend change is expected to form within the current support area and we will witness the start of an upward trend. A break of the resistance trend line will be a confirmation of the upward trend.
If the price breaks through the red support line, the downtrend is likely to continue.

check the trendGiven the 161.8% level being broken, the continuation of the downward trend and correction is likely.
As long as the price fluctuates below the red resistance area, the continuation of the downward trend is likely.
