Nifty 50 Forecast with NEoWave(Update)While many analysts thought that the NIFTY50 correction was over, the index is still moving towards the specified targets. The reason I did not update the index was that we had not yet received confirmations of the end of the correction.
It seems that the minimum target for the NIFTY50 index is the same number as I mentioned earlier and after reaching the target, we will check whether the correction is over or will continue to decline.
The pattern is still diametric and we only changed the position of the labels (c)-(d)-(e). If 23879 is broken strongly, we can say that the NIFTY50 correction is over.
Previous analysis
Neowaveanalysis

USDT.D(based on NEo wave) short termIm waiting for wave f and g but not sure about f
we should wait for it to show the pattern and breaking down 5.4 will confirm the bullish market.

BTC.D( based on NEo wave)Bitcoin dominance is too messy for counting but I just count 2 time frames and I find out there is a little bearish wave on the way but breaking 62% confirms this.
if it happens good bullish wave can make eth over 4K

Gold(based on NEo wave)on this branch of gold it is making a symmetrical and wave g is ending>
I think a good corrective wave is on the way!

usdt.d(based on Neo wave)This is the final branch of corrective wave and with breaking down 5.15 the bullish wave of crypto begins . for more information follow every counting of charts.

USDT.D(based on NEo wave)The first bearish wave is a complex ( symmetrical and diametrical) which I consider this as A wave and the bullish wave is also a diametrical that I consider this as B wave which is ending and after this we can see a heavy bearish wave which can make ETH above 5000$.

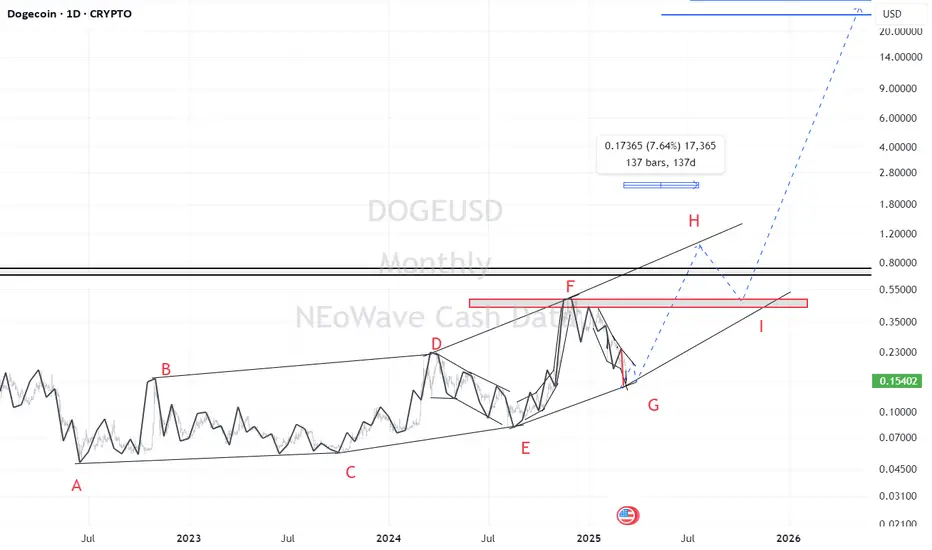
Doge(based on NEo wave)Doge is making a symmetrical which is a boring pattern and it takes too much time!
in about 150 days it will touch 0.90 _ 1 and after that a correction to 0.4_0.5 and after this it will pump too strong.
ETH(based on NEo wave)This supercycle is a nice nature triangle which E wave is ending and its look like a diamon diametrical.
so I will update it for the confirmation, I think ALTseason is so close and we can see that happening soon but this season take about 400 to 450 days and after that there is a huge CRASH!

BITCOIN NEOWAVE ANALYSISBitcoin appears to be forming an ABC correction pattern, with wave B completing precisely at the 1.38 Fibonacci extension of wave A.
Since waves A and B have taken roughly equal time to form, wave C is expected to be longer and more drawn-out.
It seems likely that wave C could extend until around 2028, though an earlier completion by 2025 remains possible.
Wave C targets two key levels, each with its own probability:
The higher-probability target is the 0.618 Fibonacci retracement of wave B, around $33,000.
Alternatively, wave C could match the length of wave A, pointing to around $28,000.
Both scenarios indicate a significant correction before Bitcoin resumes its upward trend.
It's important to note that the price could potentially break the ATH one more time before reversing downward. This scenario might resemble the pattern observed at the end of wave G, where a final upward surge preceded a significant decline.

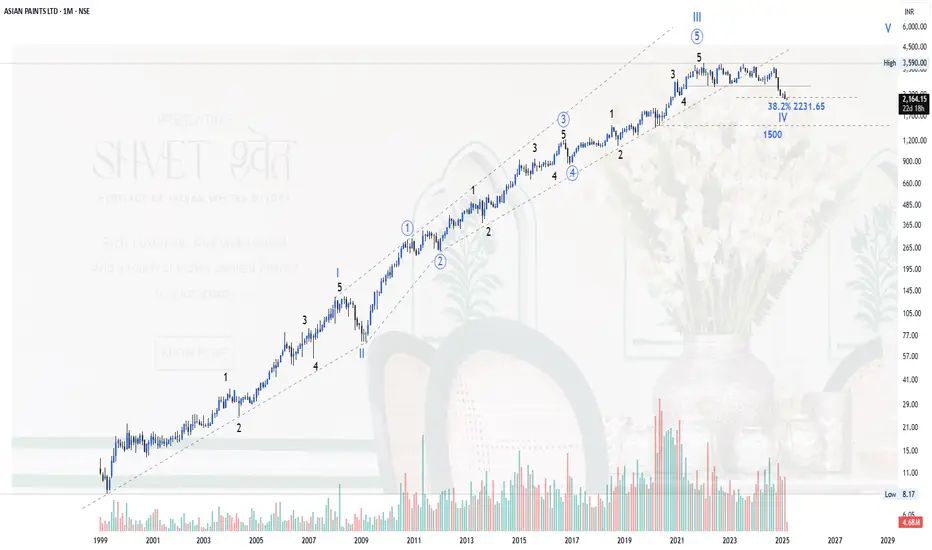
Asian Paint Chart Structure Elliott wavePlease refer to the chart of Asian Paints Ltd., have tried to put everything on chart. The Chart is a long term chart. It seems that it is progressing in wave IV of its higher degree waves. The wave IV has retraced moved than 38% of its wave III. Lower level may also be seen in near future.
Please check the chart and follow for such charts.
Regards
Bitcoin on Mid-TermBitcoin seems to be in a bullish diametric in the medium term and we are now in wave-F of it. This wave itself is a neutral triangle and can be completed by April 15, 2025. After that we can see a rise to 13000-15000 in Bitcoin

Nifty 50 Elliott Wave Analysis: Potential Retracement LevelsNifty 50 Elliott Wave Analysis: Potential Retracement Levels
The wave count for Nifty 50 has been structured from the Covid-19 lows of 23rd March 2020. Since then, the index has undergone a well-defined Elliott Wave progression, forming distinct impulsive and corrective waves. Below is a breakdown of the wave structure and the potential retracement targets.
Wave Count Breakdown:
1. Intermediate Wave (1):
o Completed in October 2021 with a high of 18,604.45.
2. Corrective Wave (WXY) - Intermediate Wave (2):
o A corrective retracement followed, unfolding in a WXY pattern.
o The correction concluded on 13th June 2022, with a low of 15,183.40.
o The retracement was less than 38%, indicating a strong bullish phase.
3. Intermediate Wave (3):
o Nifty commenced its third wave, subdividing into a five-wave structure of a minor degree.
o This bullish wave extended significantly and peaked on 23rd September 2024, with a high of 26,277.35.
Retracement Expectations:
• Wave (3) exhibited an extended Wave 3, and according to the Elliott Wave principle, when Wave 3 is extended within a subordinate wave structure, a retracement typically occurs towards:
o The bottom of subordinate Wave 4 or
o 38.2% Fibonacci retracement level
• Key levels to watch for potential retracement:
o 38.2% Fibonacci retracement: 22,039.45
o Wave 4 bottom (4th June lows): 21,281.45
If the retracement aligns with Elliott Wave rules, we may see a pullback toward these levels before the next bullish wave resumes.
Pls follow for such insightful ideas.
Disclaimer :
This analysis is for educational and informational purposes only and should not be considered as financial or investment advice. Market movements are subject to various factors, and past patterns do not guarantee future performance. Please consult with a certified financial advisor before making any investment decisions.
________________________________________
With these insights, traders and investors can monitor Nifty 50's price action closely to determine whether the expected retracement unfolds as anticipated.

INJUSDT NEOWAVE ANALYSISWave A is the fastest and strongest wave on the chart, indicating that the long-term trend is up, and any downward wave is counter-trend.
The pattern is a flat correction, confirmed complete in April 2024 with the drop from $52 to $18.
Currently, we appear to be in an X wave.
The X wave can be labeled as small or large based on its retracement of the entire pattern. Since it is not yet complete, I cannot provide further details based on the monthly chart.
However, the price is likely to fully retrace the $13 low, and it should head lower.

Elliott Wave Analysis of BTC/USDTOverview
This analysis focuses on the Elliott Wave count of BTC/USDT, starting from the significant low on November 21, 2022, at $15,484.34. The price movement since then has followed a structured wave pattern, with identifiable impulse waves and corrections.
Wave Structure
Wave (1):
BTC initiated its uptrend, forming minute degree wave (1) on April 14, 2023, reaching a high of $31,019.60.
Wave (2):
A corrective phase followed, bringing BTC to a low of $24,899.97 on September 11, 2023.
Wave (3):
After completing wave (2), BTC started an impulsive move for wave (3), which culminated on March 14, 2024, at a high of $73,800.
Wave (4):
A time-based correction followed, marking a low of $48,974 on August 5, 2024.
Wave (5):
The final impulsive wave (5) then unfolded, reaching an estimated high of $109,900 on January 20, 2025.
Post-Wave (5) Projection
After the completion of wave (5), a corrective phase is expected. Based on the Fibonacci retracement tool, BTC is anticipated to retrace 50% to 61.8% of its entire impulse move. This suggests a retracement zone between approximately:
$62,659.89 (50% retracement)
$51,521.34 (61.8% retracement)
BTC is expected to consolidate within this range before forming a new directional trend.
If price breaks $89,414 early, it will be clear confirmation of the completion of wave (5).
Conclusion
The Elliott Wave count suggests that BTC has completed a five-wave structure and is now poised for a corrective phase. Traders should watch for price action around the Fibonacci retracement levels to assess potential support and future market movements.
Disclaimer
This analysis is for informational purposes only and should not be considered financial advice. Cryptocurrency investments carry risks, and past performance is not indicative of future results. Always conduct your own research and consult with a professional before making investment decisions.

ETHUSDT in Short-TermEthereum appears to be poised to begin a multi-month bullish move in the short term.

MetisIt seems that the Metis has completed a bowtie diametrical and if it breaks $40, this pattern will be confirmed. After this pattern, we expect the currency to grow to $100.

ADAUSDT"In this analysis, I aimed to examine the entire structure of Cardano from the beginning. I identified that we are currently within a corrective structure, and the current position appears to be the third wave of this correction. I anticipate that it may unfold as a Diametric pattern. Follow me to stay updated as we track this structure!"

Doge(based on Neowave)now is the time to buy doge is offering a good price,soon it will start pumping to 4$

Doge(based on NEo wave)f wave of bow tie diametric is expanded so g wave shouldn't be too strong and also we can forget that bigger triangle and WXY is a better counting.

neiro usdt long term analysis hi guys.it seems neiro after zigzag pattern name a goes to wave b as a triangle pattern .i think wave e of triangle pattern becomes ended and i expect that neiro goes up at up as long term.thanks guys for your support.

neiro usd triangle patternhi guys .i see triangle pattern on neiro usdt and i expect that neiro goes up at least to 0.0017. lets see what happens.thanks for your support.

Doge(based on NEo wave)last counting failed but there is these 2 bullish scenarios for doge and I think soon we will see a dog which can fly!
one of the ways is complex corrective wave which contains WXY waves and the other one is triangle with ABCDE waves.
in short term the bow tie diametric with G wave (which is not formed yet), I prefer to buy more on G wave.

SOLANA NEOWAVE ANALYSIS The chart shows a simple zigzag pattern
Solana is currently in wave C.
The minimum target for the coming year is $540, as wave C of the zigzag should at least reach the 0.618 fib level.
Typically, a normal wave C can range from anywhere between the 0.618 to 1.618
Given Solana’s overall bullish structure, I believe the current price represents a strong buying opportunity and a loading zone.
