USDT.D neowave analysisIt's a good time to open some short positions.
The G wave has ended, and we're going to have a new downtrend rally, so buckle up.
Neowaveanalysis

BTCUSD MAY BE STILL DOWN TREND OR SIDE WAY AS LARGE X ???According to the previous BTCUSD price forecast, the Price should be hit under 24,000$ - 19,000$ but it takes a too long time, Next week it may be still sideway or continue downtrend, let it be (Main Trend still in a downtrend, Mid Trend is sideway, Short trend is downtrend but reach first 100% targets of ZIGZAG)
BITSTAMP:BTCUSD
Anyway, let's share any ideas, and feel free to comment.

BTCUSD MAY REACH AROUND 20,000$ BEFORE NEXT BULL RUNI think BTCUSD may reach 25,000$ - 20,000$, And Then start the new bull run again (The next target is above 100,000$) Wave "C" of may be finished in late June or early July. Then sideway - up and will be confirm bull run late 2022 or early 2023
BITSTAMP:BTCUSD
Feel free to share and comment the ideas.

APEUSDT WAVE A TARGETI think the APEUSDT may do a thing like this, After finishing the main ZIGZAG (A/1), Now it is in making (B/2) and currently building wave "a" in (B/2).
The first Target is around 12.86$, Second Target is 10.7$ (I bias myself it will go to 10.7$, but anything can happen)
BINANCE:APEUSDT
Let's comment on this analysis, I'm new to Elliott wave/Neo wave, and Have fun with trading :D :D :D

Bitcoin Neowave AnalysisBitcoin has made a corrective pattern from may 2021. We think the corrective pattern is FLAT or NEUTRAL TRIANGLE and now we are in wave C (yellow) of this correction.

Bitcoin in Short-TermBase on Long-Term view, I think Bitcoin on a bearish standard impulse pattern. It is the 3th-extended impulse pattern and it can end at 20000-22000$ range. after that bitcoin can go up and speed and amount of this advance will show the Next scenario.

BTCUSD in Long-TermHi
I think Bitcoin is on a bullish diametric pattern in long-term since 2009. that we are in wave-G. we can consider 2 scenario now.
1- we can assume wave-G have been ended at 67000$ and we started a wave -X that can be continue to year 2024.
2-we can assume wave-G have not been completed yet and it will develop as a diametric itself.
If BTCUSD break 20000$ in the next 2 month, I choose scenario 1. else scenario 2 is the best.

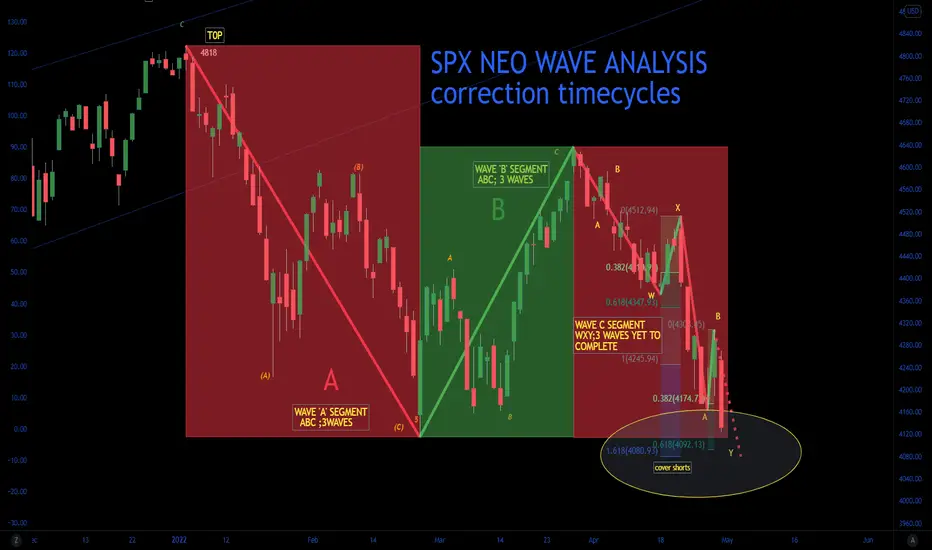
SPX -Neo wave AnalysisSPX price action on Monday (2/5/22)will decide the future course of correction.
Neo wave charts are simple and easy to predict market timing and direction.
Price levels inside the ellipse are crucial and if 4080 respected (not breached)close the shorts for a while
NEO WAVE timing for NIFTYA 5 wave Diagonal with quick reaction pattern formed in NIFTY.
Reaction waves took less time in triangles, wedges.
as per previous pattern analysis there is a due for wave 'E'
this is the deciding wave at final stage after 'SMART SELL OFF' completed.
so far bullishness is intact @ 55% retracement of wave 'E'(blue dotted line).
next 2 days(3rd may'22) price action is more important for NIFTY ,and it should not breach 16830.
failing which wave 'C' will extend further to 16525

btc btcusdt neowave analysis 1Dthis is what i think for daily and weekly time frame and i think this is a more possible scenario share your opinion and send me your comment

btc btcusdt neowave analysis, what is the next move?i think btc should test 38700 again but its possible to break 40500 and continue up trend

btc btcusdt neowave analysis look closeri think this is a diametric diamond pattern get complete but i am not sure this is an ABC X ABC or diametric


DogeCoin Elliott wave AnalysisA structure Completed
Wave 1 of Next Impulse Formed and Now in wave 2 Corrective wave
If wave C of 2 , 100% Retraced in time less than C
We in Wave 3
TP1 Marked in Chart

btc btcusdt neowave analysis look closerso we looking closer to btc chart this analysis depends on the previous two analyzes

btcusdt base on elliot neowave in 15min time framedepend on last analysis if we analysis btc on 15 time frame we have an Horizontal expanded triangle and wave E starting to be complete

btcusdt base on elliot neowavewe are in zigzag pattern and we are in wave B , wave B is a Standard or reverse Alternation Neutral , but trend line show us Standard pattern is more possible one , so i show you where and when price can go for wave E

Nifty Neowave Analysis - 17777 a Magnet?After a sell off, we are heading towards 17777. Target can be achieved before 27th april. This level 17777 will prove an important turning point for future trend.

Nifty Neowave AnalysisNifty correction expected to end by mid of June. We are going to see more declines in next few days.


BNBUSD WAVE And Pattern Analysis The correctional structure, especially the three waves, whether in descending or ascending and pulse correction, indicates the formation of a diametric pattern.
This post is just a personal idea and analysis should not be the criterion for buying or selling
The last specified pattern is currently in a flat pattern. The structure is in high time and the whole chart is in the form of a diametric pattern. You can see the ascent from this area, but lower levels can be achieved

AMZN WAVE AND PATTERN ANALYSIS Be sure to stick to Stop Lost and TAkE Profit. This is an idea and not a bargain offer
It has the structure of an ABC FLAT Failure Irregular and the price is likely to go down to the specified range
