ZIGZAG wave-c has startedContinuing the previous gold analysis
It seems that wave-(b) is turning into a normal zigzag and wave-c has started from the zigzag. Wave-c of this zigzag could end in the range of $3200-3216 or $3104-3118.
After the zigzag ends, we will have another upward movement in gold.
Neowaveforecast

Bitcoin NEoWave AnalysisBased on the wave count, it seems that Bitcoin has entered a new uptrend after completing a long-term correction in the form of a neutral triangle pattern.
Since the first wave of this uptrend has an impulse structure, it can be said that a bullish zigzag pattern is taking shape, and we are currently in wave B of it.
Based on the analysis, wave B of the zigzag can develop into a neutral triangle, with wave D continuing to the $100,000 or $110,000 level, and wave E can also retrace about 38% of it.
With the completion of wave B, the price can enter wave C with a target of $158,000 to $180,000.

Start of Wave-(b) and Neutral Triangle As I said in the second paragraph of the previous analysis, wave-(a) ended at 3500 and the gold price fell by 7% (over 2000 pips) and now wave-(b) has started.
1M Cash Data Chart
I think that a neutral triangle or a reverse contracting triangle is forming, with the completion of wave(b) we can somewhat understand which pattern is forming.

Gold Uptrend ContinuesThe higher degree diametric wave-(E) is expanding and we can consider the recent price correction that started at $3167 as a small X-wave, as a result, gold can grow as a combination pattern to the range of 3600-3800 and even gold can touch $4000.
The second triangle pattern will probably be a neutral triangle or a reverse contracting triangle, where the wave-(a) triangle can end at 3500 or 3600.
The factor that caused the expansion of the wave-(E) is the US-China trade war, which caused investors to rush to buy gold.

NEoWave Analysis of Bitcoin ChartBased on wave counting, it appears that Bitcoin has entered an uptrend after completing a long-term correction, the initial part of which is a zigzag pattern. The price is now entering wave C of this zigzag, which is likely to reach the $150,000 target.

"BIST100: Triangle Signals 20-25% Drop"BIST100 (XU100)
In the monthly Cash Data, we see that a Reverse Neutral Triangle has formed and the post-pattern movement (the downward movement after wave-(e)) has also confirmed it and it seems that BIST100 is preparing for at least a 20-25% correction.
If the beginning of wave-(b) is broken, i.e. the number 7189, the correction of this index can continue to 5705.

Bitcoin NEoWave Analysis Based on 6M Cash DataCash Data 6M
In the 6-month cash data for Bitcoin, it appears that a Running Neutral Triangle is forming and we are currently in wave-D of this triangle. Based on the previous mid-term Bitcoin analysis, as long as Bitcoin’s price remains above $70,000 there is potential for the price to rise to $150,000. Therefore, wave-D of the neutral triangle could expand and grow larger.
Until wave-D is complete, we cannot accurately predict the endpoint of wave-E( The label-E shown in the image is not precise and will likely change) However, after wave-D concludes, the price will experience at least a 50% correction to complete wave-E of the triangle, followed by a strong upward move in Bitcoin.
The analysis will be updated once wave-D is complete.
Good luck
NEoWave Chart

SSE Composite Index CorrectionThe SSE Composite Index, the primary index of the Shanghai Stock Exchange, reflects the performance of diverse companies across various industries and serves as a gauge of China’s economy. It is calculated based on the market value and stock prices of these companies.
According to daily Cash Data (1D), the SSE Index, after a 36% rise from September 18 to 30, 2024, entered a corrective phase that has lasted about 4 months.
Based on the time and price similarity of the waves, it appears the correction is forming a diametric pattern. Wave (e) is likely complete, and wave (f) has begun. Wave (g) may end at 3,138 or 2,945, though the completion of wave (f) will allow a more precise prediction of wave (g) endpoint.
This diametric pattern will likely take another 2 to 3 months to complete..

USDT.D(based on NEowave)check the long term of usdt dominance then you will understand this.
according to bow tie diametric(from 12H counting) we will see a new bull run and this is the last wave of that.

Correction has begun in SPXWe can almost say that 4800 has been touched and given that the downward movement was very fast, this wave is most likely the A-wave of a triangle and the upward waves that are forming after the 90-day suspension of the stalls are considered as a corrective wave.
Previous SPX Analysis

USDT.D(based on NEo wave) short termIm waiting for wave f and g but not sure about f
we should wait for it to show the pattern and breaking down 5.4 will confirm the bullish market.

BTC.D( based on NEo wave)Bitcoin dominance is too messy for counting but I just count 2 time frames and I find out there is a little bearish wave on the way but breaking 62% confirms this.
if it happens good bullish wave can make eth over 4K

Gold(based on NEo wave)on this branch of gold it is making a symmetrical and wave g is ending>
I think a good corrective wave is on the way!

S&P 500 resistance levels#SPX
Upon observing the 6-month cash data of the S&P index, it becomes clear that this index has reached significant resistance levels. However, it is still too early to proclaim the beginning of a major correction in this index. That said, it can be anticipated that a potential price correction might extend to the range of 4800 to 4500.
When comparing the wave count of this index with the Warren Buffett Indicator, both reveal a common message: the S&P is currently situated in sensitive zones.
There are two critical price ranges for this index that could lead to significant price reversals: the first range is between 6085 and 6240, and the second range is between 7900 and 8000.

usdt.d(based on Neo wave)This is the final branch of corrective wave and with breaking down 5.15 the bullish wave of crypto begins . for more information follow every counting of charts.

USDT.D(based on NEo wave)The first bearish wave is a complex ( symmetrical and diametrical) which I consider this as A wave and the bullish wave is also a diametrical that I consider this as B wave which is ending and after this we can see a heavy bearish wave which can make ETH above 5000$.

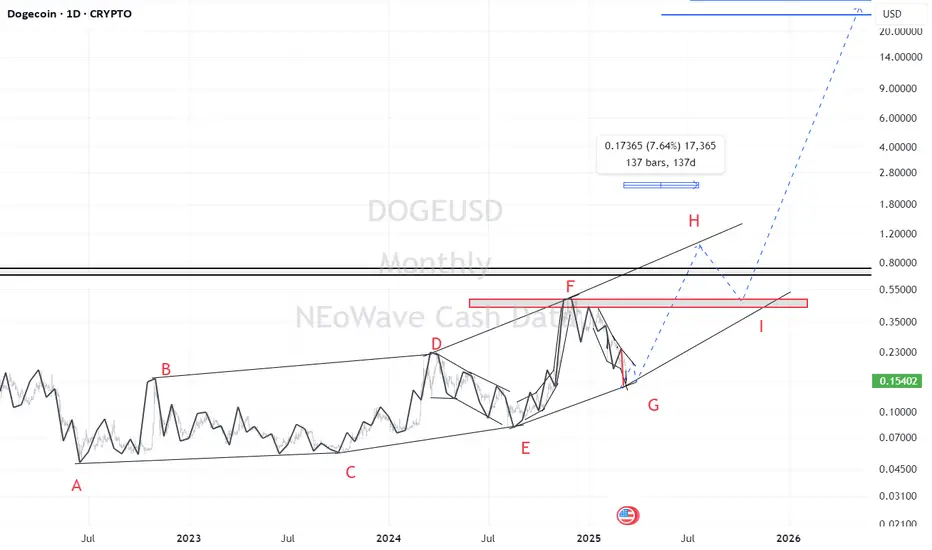
Doge(based on NEo wave)Doge is making a symmetrical which is a boring pattern and it takes too much time!
in about 150 days it will touch 0.90 _ 1 and after that a correction to 0.4_0.5 and after this it will pump too strong.
ETH(based on NEo wave)This supercycle is a nice nature triangle which E wave is ending and its look like a diamon diametrical.
so I will update it for the confirmation, I think ALTseason is so close and we can see that happening soon but this season take about 400 to 450 days and after that there is a huge CRASH!

BITCOIN NEOWAVE ANALYSISBitcoin appears to be forming an ABC correction pattern, with wave B completing precisely at the 1.38 Fibonacci extension of wave A.
Since waves A and B have taken roughly equal time to form, wave C is expected to be longer and more drawn-out.
It seems likely that wave C could extend until around 2028, though an earlier completion by 2025 remains possible.
Wave C targets two key levels, each with its own probability:
The higher-probability target is the 0.618 Fibonacci retracement of wave B, around $33,000.
Alternatively, wave C could match the length of wave A, pointing to around $28,000.
Both scenarios indicate a significant correction before Bitcoin resumes its upward trend.
It's important to note that the price could potentially break the ATH one more time before reversing downward. This scenario might resemble the pattern observed at the end of wave G, where a final upward surge preceded a significant decline.

Gold intraday view (Neowave Forecast)Hi everyone
Price is still trying to test the high 2956 using daily supports level.
I think price wont go down today...so expect some bullish swings.
and this levels should breach on monday, may be this friday.
Thank You

Bitcoin on Mid-TermBitcoin seems to be in a bullish diametric in the medium term and we are now in wave-F of it. This wave itself is a neutral triangle and can be completed by April 15, 2025. After that we can see a rise to 13000-15000 in Bitcoin

INJUSDT NEOWAVE ANALYSISWave A is the fastest and strongest wave on the chart, indicating that the long-term trend is up, and any downward wave is counter-trend.
The pattern is a flat correction, confirmed complete in April 2024 with the drop from $52 to $18.
Currently, we appear to be in an X wave.
The X wave can be labeled as small or large based on its retracement of the entire pattern. Since it is not yet complete, I cannot provide further details based on the monthly chart.
However, the price is likely to fully retrace the $13 low, and it should head lower.

MetisIt seems that the Metis has completed a bowtie diametrical and if it breaks $40, this pattern will be confirmed. After this pattern, we expect the currency to grow to $100.
