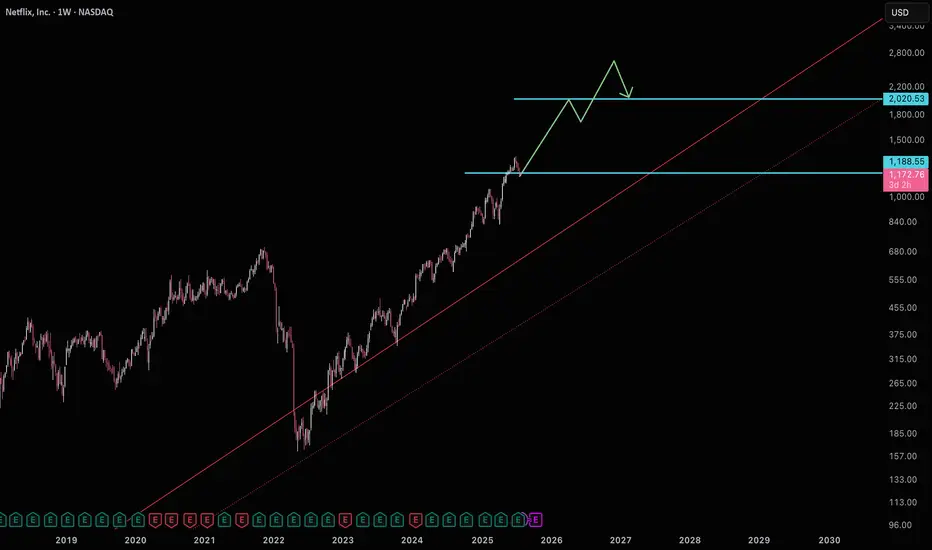
Netflix building support for $2000Netflix is currently sitting on support getting ready for a move to $2000.
Good luck!
Netflix
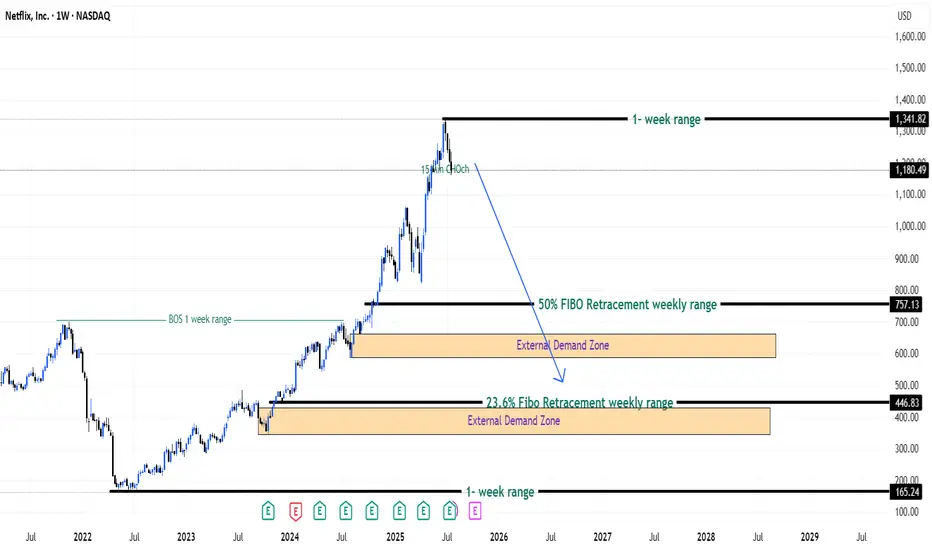
Bulls Quit? Bears Ready! - Netflix Stock (USA) - {27/07/2025}Educational Analysis says that Netflix (USA Stock) may give trend Trading opportunities from this range, according to my technical analysis.
Broker - NA
So, my analysis is based on a top-down approach from weekly to trend range to internal trend range.
So my analysis comprises of two structures: 1) Break of structure on weekly range and 2) Trading Range to fill the remaining fair value gap
Let's see what this Stock brings to the table for us in the future.
DISCLAIMER:-
This is not an entry signal. THIS IS FOR EDUCATIONAL PURPOSES ONLY.
I HAVE NO CONCERNS WITH YOUR PROFITS OR LOSS,
Happy Trading,
Stocks & Commodities TradeAnalysis.
My Analysis is:-
Short term trend may be go to the external demand zone.
Long term trend breaks the new high after going from discount zone.
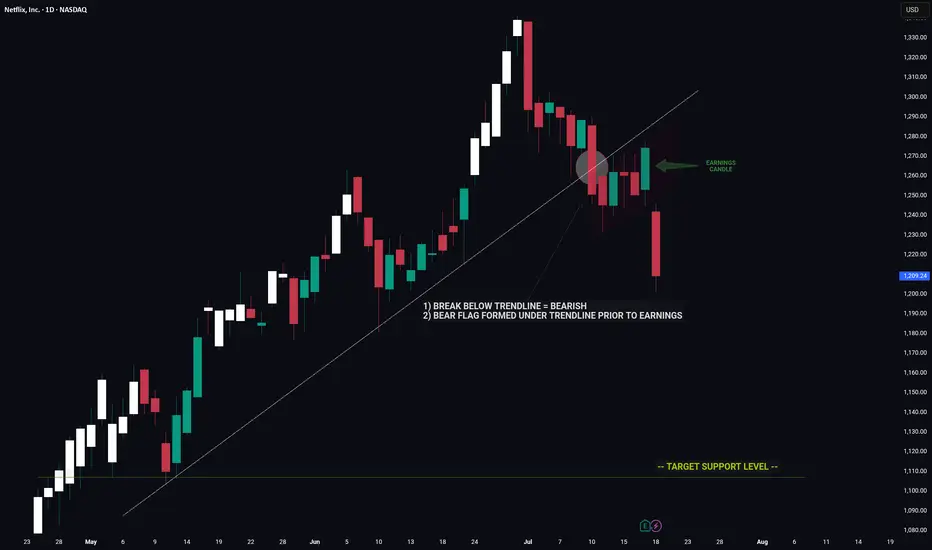
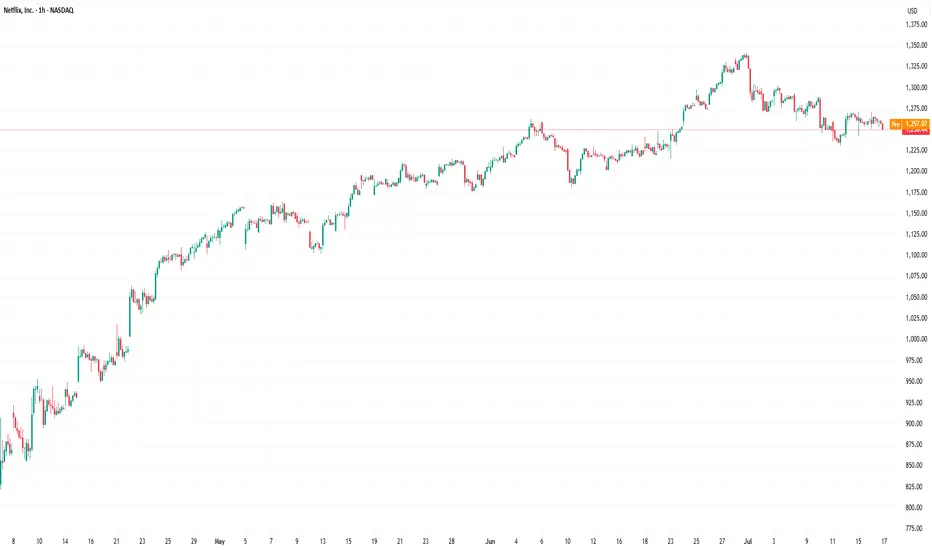
NETFLIX -- Price Signaled A Move Lower Prior To EarningsHello Traders!
The chart of NFLX is a great example of using clues to decipher a future move.
Prior to earnings we had major bearish indicators on the chart that hinted towards a move down on earnings.
1) Break below major trendline
2) Bear flag
These two signals by themselves are very bearish however the fact that these signals appeared coming into earnings was an even strong indicator of a potential for negative move.
Now that the upward trend is broken NFLX has a long way to fall before reaching the next key support level.
Thanks everyone and best of luck on your trading journey!
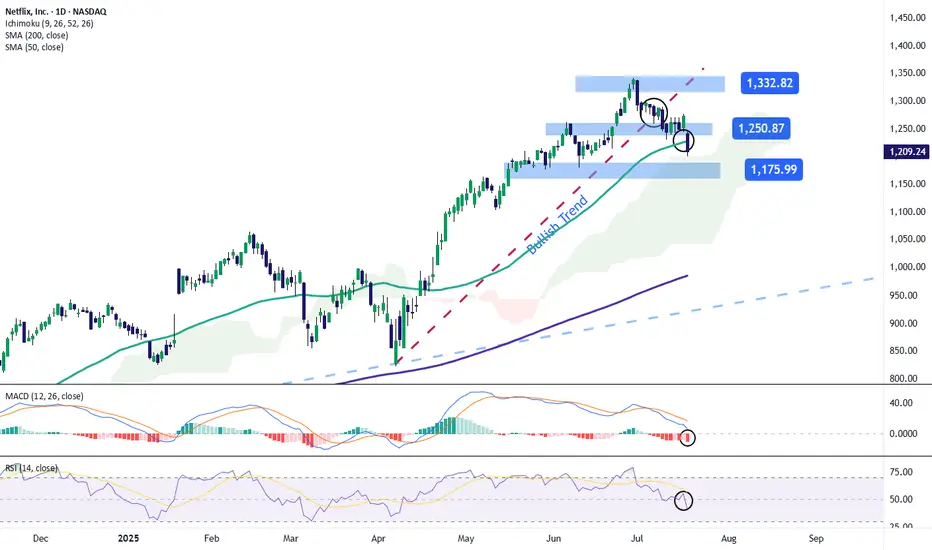
Netflix Stock Drops After Earnings ReleaseShortly after publishing its financial results, Netflix posted a decline of over 5% toward the end of the week and continues to show a strong bearish bias. This comes despite reporting a positive earnings per share (EPS) figure of $7.19, beating the expected $7.08, and revenue of $11.08 billion, slightly above the forecast of $11.07 billion.
However, in its post-earnings communications, the company stated that it expects very moderate growth for the remainder of the year. It also warned that the positive indicators could begin to compress due to increased spending on marketing and content, which has ultimately weakened the impact of the solid financial results. As a result, the stock faced persistent selling pressure heading into the weekly close.
Uptrend Breaks
Over the past few weeks, starting in early April, the stock had followed a steady uptrend, pushing the price above $1,300. However, continued bearish corrections have now brought the price down to the $1,200 area, causing a clear break in the previous uptrend. This breakdown could further strengthen the bearish pressure in the coming sessions if the negative sentiment persists.
MACD
The MACD histogram continues to move below the zero line, and as it drifts further from this level, it signals a steady bearish momentum that could remain dominant in the near term if the trend continues.
RSI
The RSI line has broken sharply below the neutral 50 level, indicating a clear dominance of bearish momentum in the market. As long as it does not reach oversold territory, this move may suggest a continued increase in short-term selling pressure.
Key Levels:
1,332 – Recent High: This is the most important resistance level. If price action returns to this area, it could reactivate the previous uptrend, which had been weakening on the chart.
1,250 – Nearby Resistance: A barrier defined by the most recent neutral zone. It may act as a temporary ceiling against short-term bullish corrections.
1,175 – Key Support: A critical level located below the 50-period simple moving average. If the price breaks below this level, it could strengthen a bearish bias and trigger a more consistent downtrend.
Written by Julian Pineda, CFA – Market Analyst
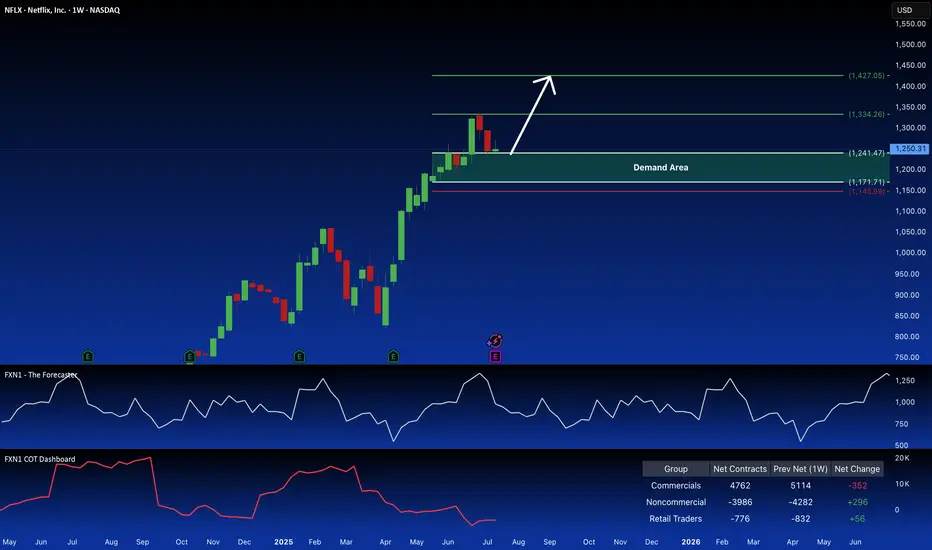
NFLX: Bullish Signal in Demand ZoneNetflix (NFLX) recently retraced within a key weekly demand zone, potentially presenting a long opportunity. Non-commercial traders are also accumulating long positions in the stock. This suggests a possible bullish setup. Your thoughts?
✅ Please share your thoughts about NFLX in the comments section below and HIT LIKE if you appreciate my analysis. Don't forget to FOLLOW ME; you will help us a lot with this small contribution.
How Earnings Reporting Could Impact Netflix (NFLX) Share PriceHow Earnings Reporting Could Impact Netflix (NFLX) Share Price
Earnings season is gaining momentum. Today, after the close of the main trading session, Netflix (NFLX) is set to release its quarterly financial results.
Analysts are optimistic, forecasting earnings per share (EPS) of $7.08, up from $4.88 a year earlier, and revenue growth to $11.1 billion.
The upbeat sentiment is driven by:
→ the fact that Netflix’s business model is relatively resilient to tariff-related pressures;
→ the company’s success in curbing password sharing and promoting a more affordable ad-supported subscription tier.
Netflix has reported revenue growth for six consecutive quarters, outperforming competitors such as Disney, Amazon, and Apple. Its market share has climbed to 8.3%, with YouTube remaining its only serious rival—YouTube's share increased from 9.9% a year ago to 12.8% in June, according to Nielsen. If current trends hold, this reporting quarter could mark another strong performance for Netflix.
However, is the outlook truly that bullish?
Technical analysis of NFLX stock chart
The NFLX stock price is currently moving within an ascending channel (marked in blue), and it is now testing the lower boundary of this formation. Of concern is the recent pronounced bearish movement (B), which has dragged the stock from the channel’s upper boundary to its lower edge—erasing the bullish momentum (A) that followed the breakout above the $1,250 resistance level.
What’s next?
→ On the one hand, bulls may attempt to resume the upward trend within the channel.
→ On the other hand, bears could build on their recent momentum (highlighted in red) and break the ascending trend that has been in place since May.
It appears the fate of the current uptrend hinges on the market’s reaction to today’s earnings release.
This article represents the opinion of the Companies operating under the FXOpen brand only. It is not to be construed as an offer, solicitation, or recommendation with respect to products and services provided by the Companies operating under the FXOpen brand, nor is it to be considered financial advice.
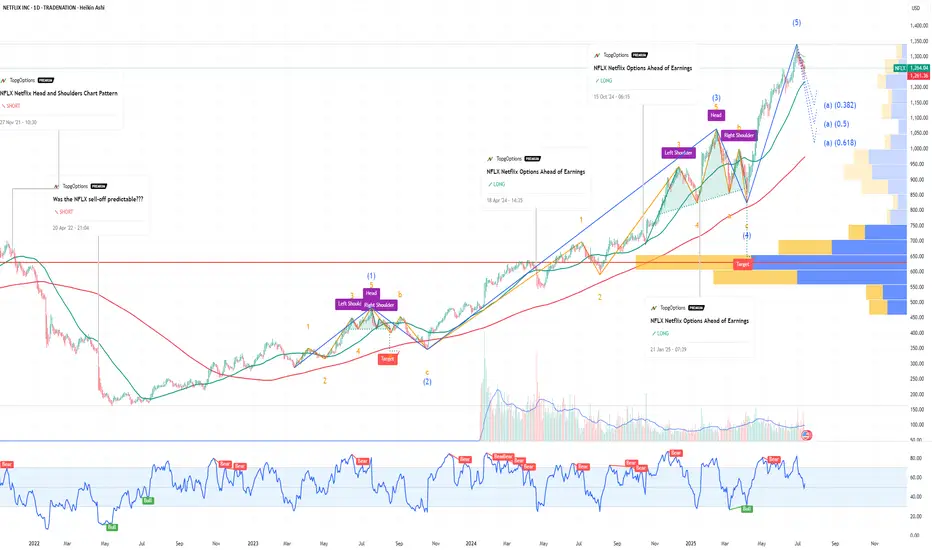
Netflix: Hovering Just Below Key Target ZoneNetflix has rebounded over the past two sessions after falling below the beige Short Target Zone ($1,270–$1,432) and is now trading just beneath it. A renewed push into this range could complete turquoise wave 3, followed by a corrective wave 4 likely dipping below $1,180. Alternatively, with a 33% probability, turquoise wave alt.3 may already have peaked, opening the door for an immediate drop through $1,180. A broader correction in beige wave IV is expected once wave III concludes, before upside resumes in wave V.
📈 Over 190 precise analyses, clear entry points, and defined Target Zones - that's what we do (for more: look to the right).

NFLX Netflix Options Ahead of EarningsIf you haven`t bought NFLX before the previous earnings:
Now analyzing the options chain and the chart patterns of NFLX Netflix prior to the earnings report this week,
I would consider purchasing the 1260usd strike price Puts with
an expiration date of 2025-9-19,
for a premium of approximately $71.10.
If these options prove to be profitable prior to the earnings release, I would sell at least half of them.
Disclosure: I am part of Trade Nation's Influencer program and receive a monthly fee for using their TradingView charts in my analysis.
Netflix Faces Rising Volatility and Bearish Technicals Ahead of Netflix (NASDAQ: NFLX) will announce its results after the close of trading in New York on Thursday, 17 July. Analysts forecast the NASDAQ-listed streaming media company to report second-quarter earnings growth of 45%, reaching $7.08 per share, while revenue is expected to increase by 15.6%, amounting to $11.1 billion. Net subscriber additions are predicted to decrease by 42.9%, falling to 4.6 million.
For the third quarter, analysts forecast guidance for revenue of $11.3 billion, up 14.7%, and earnings of $6.68 per share, reflecting growth of 23.6%. The options market is pricing in a 6.4% move, either up or down, in Netflix shares following the earnings report.
The significant expected move in the stock is driven by implied volatility levels for options expiring on 18 July, which were high at nearly 70% as of the 13 July close and are likely to increase further as results approach. Options positioning in Netflix also appears notably bullish, with call delta values surpassing put delta values. This indicates that once the company reports its results and options begin to decrease in value due to the decay of implied volatility, market makers might find themselves overly hedged on the long side, potentially forcing them to sell shares. This scenario could exert downward pressure on the stock if it fails to breach the $1,300 level, which acts as the gamma call wall.
Additionally, technical analysis shows a downside risk for the shares both before and after the results. The Relative Strength Index (RSI) for Netflix has been trending lower and recently dropped below 50, signalling a shift in momentum from bullish to bearish. Furthermore, the stock has broken down from a rising broadening wedge pattern, which is traditionally seen as a bearish reversal signal, indicating a possible decline back towards the pattern’s origin, around $1,100.
Written by Michael J. Kramer, founder of Mott Capital Management.
Disclaimer: CMC Markets is an execution-only service provider. The material (whether or not it states any opinions) is for general information purposes only and does not take into account your personal circumstances or objectives. Nothing in this material is (or should be considered to be) financial, investment or other advice on which reliance should be placed.
No opinion given in the material constitutes a recommendation by CMC Markets or the author that any particular investment, security, transaction, or investment strategy is suitable for any specific person. The material has not been prepared in accordance with legal requirements designed to promote the independence of investment research. Although we are not specifically prevented from dealing before providing this material, we do not seek to take advantage of the material prior to its dissemination.

NFLX Weekly Options Outlook — June 1, 2025🚨 Multi-Model Summary
This week’s analysis from top AI models (Grok, Claude, Llama, Gemini, DeepSeek) shows moderate bullish momentum for NASDAQ:NFLX , with a range of technical insights and trade strategies.
🧠 Model Highlights
Grok (xAI)
🔹 Technicals: Price above 10EMA, nearing overbought.
🔹 Sentiment: Bullish news (BofA), VIX low.
🔹 Trade: Buy $1290C @ $0.94 → PT $1.41 / SL $0.47
🔹 Confidence: 60%
Claude (Anthropic)
🔹 Technicals: Strong EMAs, bullish MACD on 5M.
🔹 Sentiment: BofA upgrade + options flow into $1300.
🔹 Trade: Buy $1220C @ $12.25 → PT $18–20 / SL $8
🔹 Confidence: 72%
Llama (Meta)
🔹 Technicals: Bullish near-term; RSI normalized.
🔹 Sentiment: BofA bullish note, minor CNBC drag.
🔹 Trade: Buy $1290C @ $0.94 → PT $2.50 / SL $0.40
🔹 Confidence: 65%
Gemini (Google)
🔹 Technicals: Uptrend, MACD divergence noted.
🔹 Sentiment: Strong BofA note, watch $1180 max pain.
🔹 Trade: Buy $1250C @ $4.40 → PT $6.60 / SL $2.20
🔹 Confidence: 60%
DeepSeek
🔻 Bearish Divergence
🔹 Technicals: Overextended short-term.
🔹 Sentiment: Max pain + put skew → downside risk.
🔹 Trade: Buy $1100P @ $0.71 → PT $1.77 / SL $0.35
🔹 Confidence: 65%
✅ Consensus Takeaways
🟢 4 out of 5 models lean bullish
📊 Price > EMAs, sentiment tailwind (BofA upgrade)
⚠️ Max pain at $1180 could act as late-week magnet
⚡ Risk-on setup but overbought—watch for short pullbacks
🎯 Chosen Trade Setup
💡 Trade Idea: Buy NFLX $1220C (2025-06-06)
💵 Entry: $12.25
🎯 Target: $18.40 (+50%)
🛑 Stop: $7.96 (−35%)
🔢 Size: 1 contract
🧠 Confidence: 70%
⏰ Entry: At open (Monday)
⚠️ Key Risks to Watch
RSI near overbought → potential pause
Max pain gravity at $1180 into Friday
Late-week gamma decay = faster premium loss
Macro news or earnings surprises may shift bias
📊 TRADE DETAILS (JSON)
json
Copy
Edit
{
"instrument": "NFLX",
"direction": "call",
"strike": 1220.0,
"expiry": "2025-06-06",
"confidence": 0.70,
"profit_target": 18.40,
"stop_loss": 7.96,
"size": 1,
"entry_price": 12.25,
"entry_timing": "open",
"signal_publish_time": "2025-06-01 16:24:59 EDT"
}

Netflix - The bulls just never stop!Netflix - NASDAQ:NFLX - is insanely bullish now:
(click chart above to see the in depth analysis👆🏻)
The entire stock market basically collapsed during April. Meanwhile, Netflix is creating new all time highs with a +20% parabolic bullish candle. Looking at the chart, this strength is very likely to continue even more until Netflix will (again) retest the upper resistance trendline.
Levels to watch: $1.400
Keep your long term vision!
Philip (BasicTrading)

Netflix (NFLX) Share Price Reaches Record HighNetflix (NFLX) Share Price Reaches Record High
According to the charts, Netflix (NFLX) shares have risen above $1,170 – the highest level in the company’s history. Since the start of 2025, the price of NFLX stock has increased by approximately 33%, while the S&P 500 index (US SPX 500 mini on FXOpen) remains close to its opening levels from 2 January.
Why Is Netflix (NFLX) Performing Strongly?
A month ago, we highlighted several factors contributing to NFLX’s outperformance relative to the broader stock market. Among them is the fact that Netflix does not offer tradable goods subject to tariffs in trade wars. As a result, the company could potentially benefit from an economic downturn if consumers spend more time at home.
According to recent reports:
→ Netflix has announced that 94 million subscribers are now using its low-cost ad-supported plan – a figure more than a third higher than the 70 million reported in November.
→ The company also forecasts that advertising revenue will double this year.
Technical Analysis of the NFLX Share Chart
The share price continues to move within the upward channel (shown in blue) we identified previously. At the same time:
→ the price is currently near the upper boundary of this channel, which has repeatedly acted as resistance (as indicated by arrows);
→ the RSI indicator shows a potential bearish divergence.
Under these conditions, a corrective move in Netflix’s stock price cannot be ruled out – for example, towards line Q or the channel median.
This article represents the opinion of the Companies operating under the FXOpen brand only. It is not to be construed as an offer, solicitation, or recommendation with respect to products and services provided by the Companies operating under the FXOpen brand, nor is it to be considered financial advice.

Break and retest setup on NFLX soon? OptionsMastery:
🔉Sound on!🔉
📣Make sure to watch fullscreen!📣
Thank you as always for watching my videos. I hope that you learned something very educational! Please feel free to like, share, and comment on this post. Remember only risk what you are willing to lose. Trading is very risky but it can change your life!

Netflix price correction will continueBased on the 2-month Cash Data chart, it is quite clear that the diametric pattern is completing.
Considering that the diametric wave-(B) has taken a lot of complexity and time, it seems that the wave-(F) is not completed and has little complexity and time, so we considered two scenarios for the wave-(F):
Scenario 1
Considering that after the wave-(E) there was a rapid downward movement, the wave-(F) will become an irregular contracting triangle, then the wave-(G) will start and grow
Scenario 2
The wave-(F) can turn into a flat pattern with a strong wave-b. In this type of flat, usually the wave-c cannot retrace the entire wave-b, as a result, the wave-c of this type of flat pattern can turn into a terminal pattern, and then the diametric wave-(G) of a higher degree will start.

NETFLIX The 3rd Major Bull Wave has begun.Netflix (NFLX) is about to complete its 3rd straight green 1W candle since the April 07 2025 Low. That was not just any Low but a technical Higher Low at the bottom of the 3-year Channel Up.
At the same time, it almost touched the 1W MA50 (blue trend-line), which was lasted tested (and held) on October 16 2023. The bottom was also formed on a 1D RSI Bullish Divergence similar to the April 2022 major market bottom.
Those two Lows macro bottoms initiated similar rallies of +196% and +210% respectively. As a result, we expect Netflix to reach at least $2200 around this time next year.
-------------------------------------------------------------------------------
** Please LIKE 👍, FOLLOW ✅, SHARE 🙌 and COMMENT ✍ if you enjoy this idea! Also share your ideas and charts in the comments section below! This is best way to keep it relevant, support us, keep the content here free and allow the idea to reach as many people as possible. **
-------------------------------------------------------------------------------
💸💸💸💸💸💸
👇 👇 👇 👇 👇 👇

NETFLIX: Good results and BULLISH technical outlook!!If there is any NASDAQ company that is weathering the strong downturn, one of them is NETFLIX. Last Thursday, it presented BETTER-THAN-EXPECTED results for both Q1 2025 and the guidance for the next quarter.
As anticipated by the Company, this quarter is the first in which it does not publish subscriber data. It only states that growth has been "slightly" higher than estimated. This leads to focusing attention on revenue and margin growth, which show a truly positive evolution.
The EBIT margin is expanding (to 31.7% vs. 28.1% in Q1 2024) thanks to price increases in various geographies and the good performance of advertising plans. All of this, in turn, favors the acceleration of free cash flow generation (+26% y/y, up to $2,789M).
For the full year, it reaffirms guidance and maintains its estimate of reaching revenues of $43.5B/$44.5B (+12%/+14% y/y) with an EBIT margin of 29% (vs. 28% previously). In short, good figures that lead us to reiterate our positive view on the stock.
--> And its technical aspect?
If we observe the chart, its trend is clearly BULLISH, and after a price pullback, finding support on its dynamic support and RESPECTING IT!!, it has regained BULLISH STRENGTH, which, supported by the presented results, EVERYTHING POINTS TO NEW HIGHS.
---------------------------------------------------------------------------
Strategy to follow:
ENTRY: We will open 2 long positions when the price exceeds 1000.
POSITION 1 (TP1): We close the first position in the 1060 zone (+5%)
--> Stop Loss at 947 (-5%).
POSITION 2 (TP2): We open a Trailing Stop type position.
--> Initial dynamic Stop Loss at (-5%) (coinciding with the 947 of position 1).
--> We modify the dynamic Stop Loss to (-1%) when the price reaches TP1 (1060).
---------------------------------------------------------------------------
CLARIFICATIONS OF THE SET UP
*** How to know which 2 long positions to open? Let's take an example: If we want to invest 2,000 euros in the stock, what we do is divide that amount by 2, and instead of opening 1 position of 2,000, we will open 2 positions of 1,000 each.
*** What is Trailing Stop? A Trailing Stop allows a trade to continue to gain value when the market price moves in a favorable direction, but automatically closes the trade if the market price suddenly moves in an unfavorable direction by a certain distance. That certain distance is the dynamic Stop Loss.
--> Example: If the dynamic Stop Loss is at -1%, it means that if the price makes a downward movement of -1%, the position will be closed. If the price rises, the Stop Loss also rises to maintain that -1% on the gains, therefore, the risk becomes lower and lower until the position becomes profitable. In this way, very solid and stable trends in the price can be exploited, maximizing profits.

Netflix Pops as Earnings Top Estimates. Are Tariffs a Threat?Netflix NASDAQ:NFLX dropped its first-quarter earnings Thursday after market close and the headlines practically wrote themselves: a record net income, an earnings beat, and a 3% implied jump for the stock at the opening bell. All in a market where the Nasdaq is crying in the corner.
But as always in markets, the big question isn’t “What happened?”—it’s “What could mess this up?”
Ready, set, action: steep tariffs, Donald Trump, and the looming threat of a recession-fueled advertising freeze.
Let’s break down the earnings binge before we channel surf over to the risk segment. Spoiler: Netflix is on a roll—but geopolitical static might still mess with the signal.
🎬 Netflix Hits Record Numbers
The earnings season is picking up the pace. Netflix’s Q1 revenue hit $10.5 billion, up 13% from last year, with net income jumping to a record $2.9 billion. That’s a cool $600 million more than the same quarter last year—and a massive flex with earnings per share at $6.61. Wall Street was only expecting $5.71 a pop.
More importantly, the company raised its full-year revenue forecast to the range of $43.5 billion and $44.5 billion.
💿 How Many New Subs?
In case you're hunting for sub numbers moving forward—don’t bother. Netflix said last quarter they’re done reporting them quarterly. They’d rather focus on what “really matters”: revenue, operating margin, and ad growth.
In Q4 2024, the final quarter with a subscriber growth update, the company pulled off its biggest user-count gain ever: 19 million new accounts , bringing the global total to over 300 million. Not a bad way to drop the mic and ghost the group chat.
🍿 The Ads Are Working. So Are the Price Hikes.
In a move that would usually send churn metrics on a downhill slope, Netflix in January bumped its top-tier plan to $24.99/month in the US. Either that speaks volumes about content quality, or we’ve all collectively accepted that we’ll pay any price to avoid commercials.
That said, ads are quietly becoming Netflix’s next big profit lever. After a rocky launch in late 2022, the ad-supported tier is now gaining serious traction. According to estimates, 43% of new US sign-ups in February 2025 opted for the ad-tier plan, up from 40% in January. Netflix expects to nearly double ad revenue this year.
📺 Is Netflix Recession-Proof?
With interest rates high relative to four years ago, consumer wallets stretched, and geopolitical tension ratcheting up, Netflix Co-CEO Greg Peters had to address the elephant in the earnings room: what happens if people stop spending?
Streaming should survive the storm. As he put it, “Entertainment has historically been pretty resilient in tougher economic times.”
Executives also noted that during downturns, people tend to seek value. Netflix, with its endless scroll, becomes the budget-friendly indulgence of choice. It’s hard to argue with that when you’re five episodes deep into a true-crime docuseries at 3 a.m.
👀 But Then There’s That Nagging Tariff Thing...
While Netflix has so far been insulated from the direct hit of Trump’s revived trade war—most of its costs are content, not commodities—it’s not immune to broader market impact. Tariffs could rattle advertisers, especially if they trigger inflation spikes, slowdowns, or investor anxiety.
Ad budgets are notoriously skittish in volatile times, and if there’s one thing advertisers hate more than bad CPMs, it’s uncertainty. Already, there's chatter that major brands are planning to trim digital spending heading into the second half of the year.
Translation: if tariffs lead to an economic wobble, Netflix’s ad revenue (and by extension, its bullish earnings story) could face a tougher climb.
📢 Leadership Shuffle: No Drama, Just Strategy
In other corporate news, Reed Hastings, the co-founder who brought us DVD mailers, quietly transitioned from executive chair to non-executive chair. It’s more ceremonial than sensational, but it marks a passing of the torch to the current co-CEOs, who clearly have things under control—if this earnings report is any indication.
❤️ Wall Street Loves It—for Now
Netflix NASDAQ:NFLX shares are up 10% year to date, which looks especially shiny next to the Nasdaq’s NASDAQ:IXIC 16% drop. While tech has wobbled under tariff pressure and chip-stock drama ,
Netflix is moving in the opposite direction—proof that profitability, pricing power, and content diversity are still pulling in fresh capital inflows.
But don’t get too comfortable. If tariff fears escalate or ad momentum stalls, Netflix may need to prove all over again that it’s more than just a pandemic darling turned pricing juggernaut.
🎥 Final Frame: Chill Now, but Keep One Eye on Macro
Netflix’s Q1 numbers were promising — but that was just before Trump’s sweeping tariffs rattled global markets.
Added levies, recession risk, and shifting ad budgets could all become plot twists in Netflix’s otherwise upbeat storyline. For now, though, it’s lights, camera, rally.
Your turn: Are you still bullish on Netflix, or are Trump’s tariffs and economic drama changing your channel? Let us know what’s on your watchlist.

Netflix (NFLX) – A Safe Haven Amid Tariff UncertaintyKey Supporting Arguments
Amidst the unpredictability of Donald Trump's tariff policies, Netflix might serve as a defensive play.
Positive consumer sentiment, a surge in subscriber growth, and strategic hikes in subscription prices are poised to power robust results for the first quarter of fiscal year 2025.
Investment Thesis
Netflix (NFLX) is a global leader in video streaming, offering a vast library of original and licensed content to subscribers worldwide. With over 95% of its revenue stream coming from subscriptions, the company secures a solid foundation against the whims of market volatility. NFLX’s nascent foray into advertising contributes a mere 3% to its revenue, ensuring that any tremors in the macroeconomic climate have a minimal ripple effect.
Netflix's business model, anchored in subscription revenue and expansive geographic diversification, shields the company from the whims of unpredictable tariff policies. Amidst the relentless cycle of tariffs being slapped on and lifted from a variety of products and the growing tide of protectionism, streaming platforms such as Netflix, which thrive on subscription-based models, emerge as devensive assets. This is largely because they steer clear of the tumultuous world of physical goods production, importation, and exportation. The sustainability of the company’s streaming empire is anchored in its formidable user engagement—clocking in at around 2 hours per household daily—paired with historically low subscriber churn and entertainment value that punches well above its price tag. These elements collectively mitigate NFLX’s risk profile in the face of a potential recession. While advertising revenue may take a hit if trade tensions intensify and trigger an economic downturn, it is worth noting that ads only contribute to about 3% of Netflix's total revenue. Despite its worldwide footprint, the company still rakes in a hefty slice of its revenue—around 40-45%—from the U.S. market, offering a protective buffer against possible international sanctions or restrictions. Meanwhile, its strategic geographic diversification across Europe, Latin America, Asia, and the Middle East not only mitigates risks but also fortifies the sustainability of its business model.
Netflix is poised to potentially exceed expectations in its Q1 2025 earnings report. In Q4 2024, the company shattered expectations by pulling in a recordbreaking 19 million new users, a surge we anticipate will roll into 2025, powered by its rich and diverse content lineup. By the year's end, Netflix strategically hiked prices in the U.S. and UK, a move poised to bolster its Q1 2025 revenue. With a bold target of 29% growth for 2025, the company is banking on buoyant consumer spending and these subscription price upticks to hit the mark. Netflix projects a free cash flow of no less than $8 billion, creating a strategic opportunity for potential share buybacks.
Our target price for NFLX over the next two months is pegged at $1,080, paired with a "Buy" recommendation. We suggest setting a stop-loss at $880.

Netflix (NFLX) Share Price Jumps Nearly 5%Netflix (NFLX) Share Price Jumps Nearly 5%
According to the charts, Netflix (NFLX) shares rose to their highest level since early April, while the S&P 500 index (US SPX 500 mini on FXOpen) declined by approximately 0.2% yesterday.
Since the beginning of 2025, NFLX’s share price has increased by more than 8%, showing resilience in a volatile stock market that remains sensitive to the escalation of the global trade war.
Why Is Netflix (NFLX) Gaining in Value?
The strong performance may be attributed to three key factors:
Jason Helfstein, an analyst at financial holding company Oppenheimer, believes the company likely faces “limited” risks. Netflix does not sell tradeable goods subject to tariffs and could even benefit from a potential economic downturn if consumers opt to stay home more often.
According to The Wall Street Journal, Netflix has set a target of reaching a market capitalisation of $1 trillion and doubling its revenue to $39 billion by 2030.
Positive sentiment ahead of the earnings report – yes, Netflix is one of the first to release its quarterly results.
Technical Analysis of NFLX Share Chart
The share price is moving within an upward channel (shown in blue), with strong support in 2025 provided by both the lower boundary of the channel and the $840 level – a level originating from the powerful rally at the end of 2024.
On the other hand, the price has now approached the psychological $1000 level. It is possible that, in light of the upcoming earnings release (scheduled for tomorrow, 17 April), the bulls may attempt a breakout and aim to secure a foothold in the upper half of the channel.
This article represents the opinion of the Companies operating under the FXOpen brand only. It is not to be construed as an offer, solicitation, or recommendation with respect to products and services provided by the Companies operating under the FXOpen brand, nor is it to be considered financial advice.

NFLX - Long Term ChannelA large channel for NFLX that I think price will remain in
I do think a bear move is coming soon before the run up plays out
This is similar to an earlier situation on the NFLX chart that I have labelled with circles in red
Weekly chart

Netflix Earnings Growth Expected As It Prepares For Q125 ResultsNetflix (NASDAQ: NASDAQ:NFLX ) is set to report its earnings for the quarter ending March 2025 on April 17. Analysts expect year-over-year growth in both revenue and earnings. However, consensus earnings per share (EPS) estimates have been revised down slightly by 0.07% over the past 30 days. This suggests a cautious outlook among analysts.
At the close on April 11, Netflix stock traded at $918.29, down by 0.31%. In after-hours trading, the price edged slightly higher to $919.80. The stock traded with a volume of 4.07 million shares. RSI stands at 47.76, reflecting neutral momentum.
The final result could trigger a sharp price move. A positive earnings surprise might push the stock higher. On the other hand, a miss could lead to a decline. The outcome will also depend on management’s commentary during the earnings call.
Technical Analysis
On the daily chart, Netflix recently bounced off a key demand zone near the $820–$830 range. This zone had previously served as a strong support area. After touching this level, the price formed a reversal candle, signaling potential buying interest.
The stock is now hovering around $918.29, near the 50-day and 100-day moving averages at $961.61 and $931.24, respectively. If the price clears these levels, it may aim for the recent high of $1,064.50. A short-term retracement could occur before a possible continuation higher.
Volume analysis shows a spike during the bounce from support, indicating accumulation. The price pattern suggests a bullish structure is forming. Overall, eyes remain on the April 17 earnings report for the next major move, which might see Netflix surge to a new all-time high.

Netflix Short Idea: 30% Downside!Netflix - NASDAQ:NFLX Weekly Chart Analysis
Short Idea:
- Expanding Triangle Pattern Breakdown
- H&S Breakdown
- AVP GAP to fill
- Declining Wr%
- Red H5 with bearish Cross
Targets:
$750/ 695/ 595/ 543/ Maybe $400's
Not Financial Advice

Bearish Setup on NFLX: Correction Wave (C) UnfoldingTF: 4h
NFLX appears bearish at the moment. The corrective structure on the 4-hour timeframe suggests a potential decline. The current formation indicates that wave B likely completed at 998.61 , and the stock has now begun its descent into wave (C) of the correction.
The correction may extend to the 100% projection of wave A at 788.67 , or potentially deepen to 659.06 , aligning with the 1.618 Fibonacci extension of wave A. After the completion of wave (C), traders can buy for the target up to wave B at 998.61 .
I will continue to update the situation as it evolves.
