Bulls Quit? Bears Ready! - Netflix Stock (USA) - {27/07/2025}Educational Analysis says that Netflix (USA Stock) may give trend Trading opportunities from this range, according to my technical analysis.
Broker - NA
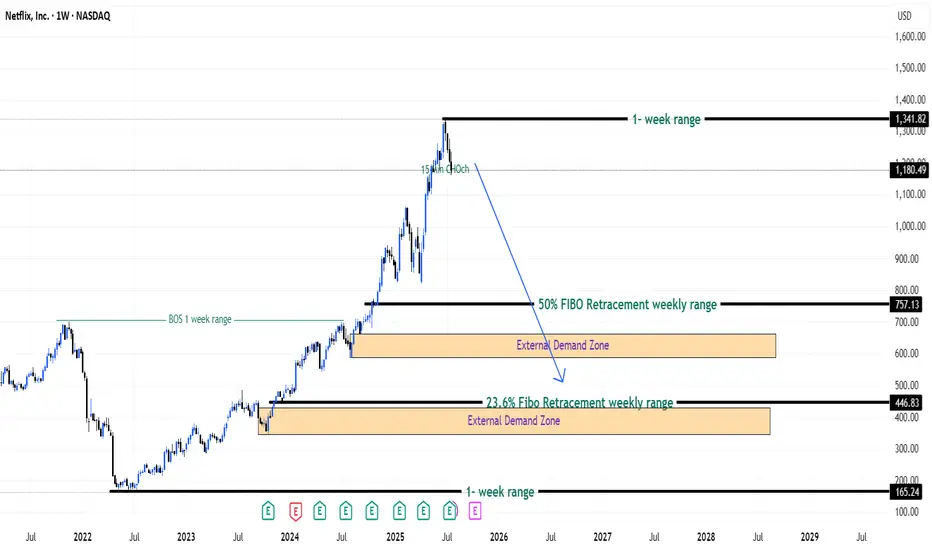
So, my analysis is based on a top-down approach from weekly to trend range to internal trend range.
So my analysis comprises of two structures: 1) Break of structure on weekly range and 2) Trading Range to fill the remaining fair value gap
Let's see what this Stock brings to the table for us in the future.
DISCLAIMER:-
This is not an entry signal. THIS IS FOR EDUCATIONAL PURPOSES ONLY.
I HAVE NO CONCERNS WITH YOUR PROFITS OR LOSS,
Happy Trading,
Stocks & Commodities TradeAnalysis.
My Analysis is:-
Short term trend may be go to the external demand zone.
Long term trend breaks the new high after going from discount zone.
Netflixforecast
How Earnings Reporting Could Impact Netflix (NFLX) Share PriceHow Earnings Reporting Could Impact Netflix (NFLX) Share Price
Earnings season is gaining momentum. Today, after the close of the main trading session, Netflix (NFLX) is set to release its quarterly financial results.
Analysts are optimistic, forecasting earnings per share (EPS) of $7.08, up from $4.88 a year earlier, and revenue growth to $11.1 billion.
The upbeat sentiment is driven by:
→ the fact that Netflix’s business model is relatively resilient to tariff-related pressures;
→ the company’s success in curbing password sharing and promoting a more affordable ad-supported subscription tier.
Netflix has reported revenue growth for six consecutive quarters, outperforming competitors such as Disney, Amazon, and Apple. Its market share has climbed to 8.3%, with YouTube remaining its only serious rival—YouTube's share increased from 9.9% a year ago to 12.8% in June, according to Nielsen. If current trends hold, this reporting quarter could mark another strong performance for Netflix.
However, is the outlook truly that bullish?
Technical analysis of NFLX stock chart
The NFLX stock price is currently moving within an ascending channel (marked in blue), and it is now testing the lower boundary of this formation. Of concern is the recent pronounced bearish movement (B), which has dragged the stock from the channel’s upper boundary to its lower edge—erasing the bullish momentum (A) that followed the breakout above the $1,250 resistance level.
What’s next?
→ On the one hand, bulls may attempt to resume the upward trend within the channel.
→ On the other hand, bears could build on their recent momentum (highlighted in red) and break the ascending trend that has been in place since May.
It appears the fate of the current uptrend hinges on the market’s reaction to today’s earnings release.
This article represents the opinion of the Companies operating under the FXOpen brand only. It is not to be construed as an offer, solicitation, or recommendation with respect to products and services provided by the Companies operating under the FXOpen brand, nor is it to be considered financial advice.
Netflix (NFLX) Share Price Reaches Record HighNetflix (NFLX) Share Price Reaches Record High
According to the charts, Netflix (NFLX) shares have risen above $1,170 – the highest level in the company’s history. Since the start of 2025, the price of NFLX stock has increased by approximately 33%, while the S&P 500 index (US SPX 500 mini on FXOpen) remains close to its opening levels from 2 January.
Why Is Netflix (NFLX) Performing Strongly?
A month ago, we highlighted several factors contributing to NFLX’s outperformance relative to the broader stock market. Among them is the fact that Netflix does not offer tradable goods subject to tariffs in trade wars. As a result, the company could potentially benefit from an economic downturn if consumers spend more time at home.
According to recent reports:
→ Netflix has announced that 94 million subscribers are now using its low-cost ad-supported plan – a figure more than a third higher than the 70 million reported in November.
→ The company also forecasts that advertising revenue will double this year.
Technical Analysis of the NFLX Share Chart
The share price continues to move within the upward channel (shown in blue) we identified previously. At the same time:
→ the price is currently near the upper boundary of this channel, which has repeatedly acted as resistance (as indicated by arrows);
→ the RSI indicator shows a potential bearish divergence.
Under these conditions, a corrective move in Netflix’s stock price cannot be ruled out – for example, towards line Q or the channel median.
This article represents the opinion of the Companies operating under the FXOpen brand only. It is not to be construed as an offer, solicitation, or recommendation with respect to products and services provided by the Companies operating under the FXOpen brand, nor is it to be considered financial advice.

Netflix price correction will continueBased on the 2-month Cash Data chart, it is quite clear that the diametric pattern is completing.
Considering that the diametric wave-(B) has taken a lot of complexity and time, it seems that the wave-(F) is not completed and has little complexity and time, so we considered two scenarios for the wave-(F):
Scenario 1
Considering that after the wave-(E) there was a rapid downward movement, the wave-(F) will become an irregular contracting triangle, then the wave-(G) will start and grow
Scenario 2
The wave-(F) can turn into a flat pattern with a strong wave-b. In this type of flat, usually the wave-c cannot retrace the entire wave-b, as a result, the wave-c of this type of flat pattern can turn into a terminal pattern, and then the diametric wave-(G) of a higher degree will start.

Netflix (NFLX) Share Price Jumps Nearly 5%Netflix (NFLX) Share Price Jumps Nearly 5%
According to the charts, Netflix (NFLX) shares rose to their highest level since early April, while the S&P 500 index (US SPX 500 mini on FXOpen) declined by approximately 0.2% yesterday.
Since the beginning of 2025, NFLX’s share price has increased by more than 8%, showing resilience in a volatile stock market that remains sensitive to the escalation of the global trade war.
Why Is Netflix (NFLX) Gaining in Value?
The strong performance may be attributed to three key factors:
Jason Helfstein, an analyst at financial holding company Oppenheimer, believes the company likely faces “limited” risks. Netflix does not sell tradeable goods subject to tariffs and could even benefit from a potential economic downturn if consumers opt to stay home more often.
According to The Wall Street Journal, Netflix has set a target of reaching a market capitalisation of $1 trillion and doubling its revenue to $39 billion by 2030.
Positive sentiment ahead of the earnings report – yes, Netflix is one of the first to release its quarterly results.
Technical Analysis of NFLX Share Chart
The share price is moving within an upward channel (shown in blue), with strong support in 2025 provided by both the lower boundary of the channel and the $840 level – a level originating from the powerful rally at the end of 2024.
On the other hand, the price has now approached the psychological $1000 level. It is possible that, in light of the upcoming earnings release (scheduled for tomorrow, 17 April), the bulls may attempt a breakout and aim to secure a foothold in the upper half of the channel.
This article represents the opinion of the Companies operating under the FXOpen brand only. It is not to be construed as an offer, solicitation, or recommendation with respect to products and services provided by the Companies operating under the FXOpen brand, nor is it to be considered financial advice.

Netflix: New All-time High!As expected, Netflix reached a new all-time high at $1,067, completing the magenta wave . Since then, the stock has already pulled back by nearly 20%. The ongoing magenta wave should extend further into our new magenta Target Zone, which spans $789.04 to $704.43. Since we anticipate a sustainable rebound from this range, it presents an opportunity to initiate or expand long positions. Such long entries could be hedged with a stop 1% below the Zone’s lower boundary, as there is a 30% chance that Netflix will drop below the Zone to complete the green wave alt. .

Netflix Surges Following Stellar Earnings: Time to Buy or Wait.?Video streaming powerhouse Netflix (NASDAQ: NFLX) recently delivered outstanding fourth-quarter results, significantly bolstered by robust subscriber growth. This surge in subscribers is a clear indication of Netflix's ability to navigate and thrive in the increasingly competitive streaming landscape, where numerous platforms vie for viewer attention. In response to the impressive earnings report, Netflix's stock experienced a notable increase of approximately 10%, propelling it to a new all-time high and reflecting strong investor confidence.
Currently, the stock is displaying a symmetrical triangle pattern on the 4-hour chart, a technical indicator often associated with periods of consolidation before a breakout. Given market dynamics, a retest of previous resistance levels is anticipated, which could lead to a decline in price as it fills the gap. Consequently, this presents a potential buying opportunity, with the ideal entry point estimated at around $940. This strategic level may offer investors a favorable position to capitalize on future price movements.

Sell, Hold, or Hope? Netflix Approaches $1000Hi,
Looking at Netflix's historical price behavior around psychological round numbers ($100, $500), we see a pattern that indicates it might be a good idea to lock in some profits at these levels.
Why?
- Round numbers often act as psychological barriers where prices tend to consolidate or range for a while, limiting further growth.
- There's a significant chance of a correction, especially after a strong rally like the one we've seen recently.
Both of these scenarios suggest it's worth considering taking some money off the table. One thing is for sure: please avoid letting FOMO influence your decisions at these prices - don't buy it at the moment. There will be better changes, just be patient enough!
Historical Examples of Psychological Round Numbers
$100 Level (2015-2016)
In July 2015, Netflix approached the $100 level. While it did show some upward movement, the price largely ranged around this area until late 2016. It was stuck for months, offering limited returns for those who didn't react.
$500 Level (2021-2022)
Around $500, Netflix once again demonstrated the same behavior. For about a year, the stock did little more than range around this level. This shows how powerful round numbers can be as areas of stagnation.
Current Major Level: $1000
While Netflix has surpassed previous round numbers, $1000 is shaping up to be the most significant psychological level yet. The rise to this point has been enormous, and history suggests that sooner or later, a correction is likely.
If you're not prepared to hold through a potential correction or consolidation, the current price levels might be an ideal time to lock in profits. Long-term holders who stick to their thesis might choose to ride this out, the choice is yours. However, for mid-term investors, locking in some gains here could be a wise move!
"Sell, Hold, or Hope?"
Let's say in that way - I hope that some holders will sell around current prices! ;)
All the best,
Vaido

Netflix - Crushed earnings, but now what?!NASDAQ:NFLX
When do we sell? Where are we going?
Netflix crushed recent earnings and have a ton of momentum behind them. I believe this is where we are going...
🎯$1033🎯1107
Not financial advice

Netflix (NFLX) Analysis: Multi-Timeframe PerspectiveA More Detailed analysis on Netflix (NFLX) from a Multi-Timeframe Perspective.
Check out my other analysis for a detailed explanation on this video

NFLXPair : NFLX - Netflix
Description :
Completed " 12345 " Impulsive Waves
Break of Structure
RSI - Divergence
Bullish Channel as an Corrective Pattern in Short Time Frame
Resistance Level

NFLXPair : Netflix - NFLX
Description :
RSI - Divergence
Demand Zone
Rising Wedge as an Corrective Pattern in Short Time Frame with the Breakout of the Lower Trend Line and Retracement
Break of Structure
Completed " 12345 " Impulsive Waves

NFLXPair : NFLX - Netflix
Description :
Double Top
Resistance Level
Completed " 12345 " Impulsive Waves
Impulse Corrective
Break of Structure
CHoCH

Netflix Breaking Major Support Not a Good look Hi guys! This is an Update on Netflix (NFLX) on the 1 day chart.
We are currently at risk of a trend change in the makings due to a breakdown of Major Support.
This is a zoomed in look on the daily timeframe.
But if you look at my previous idea below, notice the Uptrend Channel that Netflix has been following since June 2022.
Todays candle is currently BELOW this Support trendline of the Channel.
Not a good look for Netflix.
But brings in opportunity for take a Short, once confirmation comes in.
Notie also that with the print of the Massive BEARISH Engulfing Candle, we are now below the 21 EMA.
Note the BEARISH Engulfing Candle indicates extreme selling pressure. It shows that the majority of the previous move up to the resistance was sold off by this 1 candle print.
With this daily candle & the engulfing candle it equates to the entirety of that move.
Being BELOW the 21 EMA, tells us declines are likely ahead of us. ALso if we are where we are with the close of our current daily candle, we will confirm BELOW 21 EMA.
Thus supporting probability of further declines.
Look to the Black Horizontal Line below us for our current target for this price decline.
BUT if we can somehow move back ABOVE the channel, by the end of the week before CONFIRMATION. This could support the probability of us resuming our Uptrend.
__________________________________________________________________________________
Thank you for taking the time to read my analysis. Hope it helped keep you informed. Please do support my ideas by boosting, following me and commenting. Thanks again.
Stay tuned for more updates on NFLX in the near future.
If you have any questions, do reach out. Thank you again.
DISCLAIMER: This is not financial advice, i am not a financial advisor. The thoughts expressed in the posts are my opinion and for educational purposes. Do not use my ideas for the basis of your trading strategy, make sure to work out your own strategy and when trading always spend majority of your time on risk management strategy.

Netflix Weekly Support Convergence Test so far so goodHi guys. This is a MACRO Technical Analysis on Netflix (NFLX) on the 1 Week TImeframe.
This week we have TESTED Support on the 21 EMA and the Support trendline of the UPTREND channel.
Netflix is heavily supported not only by these 2 mentioned SUPPORT lines but also a 3rd Support, the black horizontal support line as well.
Everytime we've touched the Support line of the Channel, we've bounced to the Top of the Channel.
EXCEPT our most recent touch, that took us only half way before printing a Topping Tail Candle and selling off.
Watch how we close this weeks candle. If we close around or above $428.
That would be the best case scenario, as that would indicate an Engulfing Bullish Candle.
This could invalidate the Topping Tail Bearish Momentum.
BUT for now we need to watch what happens. Keep in mind that the Topping Tails can cause further price DECLINES.
AND we absolutely don't want a UPPER WICK for our current weekly candle. This would imply selling pressure and may indicate continuation of the TOPPING TAIL.
Watch also the VOLUME -> From here we should see increasing volume and or SPIKE in volume so price can continue up the channel.
For whatever reason if we BREAK DOWN from this SUPPORT CONVERGENCE area, the next level would be the 50 SMA.
Also NOTE, along with Topping Tail Candle, indicators are showing BEARish signs.
MACD has crossed BEARISH
RSI Broke BELOW Support Trendline.
For us to continue our UPTREND
MACD needs to CROSS BUllish and print green bars
RSI cannot print below the Horizontal Black line, as that would indicate a Lower low. And Ideally, get back above the Support Trendline and or continue UP.
__________________________________________________________________________________
Thank you for taking the time to read my analysis. Hope it helped keep you informed. Please do support my ideas by boosting, following me and commenting. Thanks again.
Stay tuned for more updates on NFLX in the near future.
If you have any questions, do reach out. Thank you again.
DISCLAIMER: This is not financial advice, i am not a financial advisor. The thoughts expressed in the posts are my opinion and for educational purposes. Do not use my ideas for the basis of your trading strategy, make sure to work out your own strategy and when trading always spend majority of your time on risk management strategy.

Netflix: Are you still watching…? 👀Well, the question should rather be: “Are you still climbing?” Indeed, Netflix still has got some room left to expand wave 1 in turquoise further upwards, although the next top can be placed anytime now as well. As soon as this is done and dusted, the share should turn downwards to develop wave 2 in turquoise before the next stage of ascent can start. However, there is a 34% chance that Netflix could continue to climb higher than primarily anticipated. In that case, we would expect the share to already develop wave alt.3 in turquoise, meaning that wave alt.1 and alt.2 in turquoise would be finished by now.

Netflix NFLX Next MovePair : NFLX ( Netflix )
Description :
Bearish Channel in Long Time Frame as an Corrective Pattern with the Breakout of the Lower Trend Line and Retracement
Break of Structure
RSI - Divergence
Completed " ABC " Corrective Wave
Bearish Channel in STF with the Breakout of the UTL need to wait until it Completed its Retest
Impulse Correction Impulse

Netflix: Bringing It on Stream 🎞Netflix has brought wave b in magenta on stream quite commendably and has already touched at the gray zone between $343.40 and $359.13. Thus, wave b in magenta could be finished by now, although the share could just as well use the remaining room in the upper part of the gray zone to place the corresponding high. As soon as this is done, the course should turn and head for the turquoise zone between $271.07 and $209.09 to develop wave B in turquoise. Afterward, Netflix should tackle the resistance at $379.43, which should then be conquered by wave C in turquoise. However, we should still keep in mind the 35% chance that the stock could break through the turquoise zone and drop below the support at $162.75.

Netflix: Continue Watching 🍿Bring on the Popcorn! The Netflix stock continues to rise and should finish the turquoise wave A soon. Once completed, the stock would fall into a correction until the course drops below the support line at $252.06 and wrap up the turquoise wave B. Once the stock hit its corrective low, the course can start an upwards trend to climb further North in the longterm.

NFLXNot financial advice.
The essence of investing & trading is the intelligent and patient preying on the greed, fear, impatience, addiction and ignorance of the majority. It's definitionally Darwinian.

NETFLIXYou can see NETFLIX is at the resistance box, I'd say it won't break it and it will go to 184$ nPOC, VAL level is the last support and below it we are looking for NTFLX to hit 140-150$ nPOC, there we can expect bounce.


NFLX Netflix: 1D Chart ReviewHello friends, today you can review the technical analysis idea on a 1D linear scale chart for Netflix, Inc. (NFLX).
The chart is self-explanatory. Death cross may be coming up. RSI just broke out of the support line. Keep an eye on the Support Zone.
Included in the chart: Trend line, Support and Resistance Lines, RSI, MFI, Death Cross, Simple Moving Average, EMA Ribbons, Volume.
If you enjoy my ideas, feel free to like it and drop in a comment. I love reading your comments below.
I have additional charts below on cryptocurrencies, stocks and more to review. Check them out!
Disclosure: This is just my opinion and not any type of financial advice. I enjoy charting and discussing technical analysis . Don't trade based on my advice. Do your own research! #cryptopickk
