Bullish view on Netflix With buy zone and sell zone $NFLXBuy Zone and target for netflix
(Not financial advice)
Netflixshort

NFLX Pre-Move Analysis |Technical look on $NFLX NASDAQ:NFLX with potential options play
Netflix makes $100 million commitment to support Black communities in the U.S.
As we come toward the end of this massive 10 month wedge, we must be patient. Throughout Covid, Netflix has performed rather well since the first wave, achieving 20% above previous 2020 highs.
Will Netflix moon into earnings? Will earnings disappoint long investors?
Comment your thoughts below!
The Plays:
Estimated Time: 7-11 weeks
- Bullish - Breakout on the upside or other bullish activity: NFLX $540 Call expiring late september, this break will result in a massive rip in which we will aim to play the continuation. Take profits!
- Bearish - Break toward downside, lose of channel: NFLX $460 Put Expiring late September or October. Chart is giving off more bearish signals than bullish but that's not pricing in Covid.
We will cover this play when the time is right, be sure to keep your eye on it.
This is not financial advice nor am I a financial advisor
DotcomJack

NETFLIX INC Long-Term Short IdeaI think there is a possibility for a long-term set and forget short. Target around 325 around the 10th of September.
I am not trading this instrument, just sharing for fun and to see what happens down the road. I want to see if what I did to get these results bears any fruit.
Trade smart. Manage Risk.

NETFLIX - Bull Flag RangeNASDAQ:NFLX is currently experiencing a range bound movement.
You can wait to lift up some quantities near the channel bottom.


NFLX, always a good investment Hello Traders,
As we said in our last analysis of Netflix stock price , Netflix’s stock is showing good performance for long terms investment.
Actually if the stock could break the resistance Max M2, we could see a growth to the resistance Max M2.
However if the stock breaks the support down, we could see a decreasing trend.


Netflix Compression. (NFLX)🤔 Two patterns taking place as we hit major level of Resistance.
Bull Pennant or Inverse Head And Shoulders.
Price is being compresses in the green pennant formation.
Safest bet is to play the pennant breakouts to the up or the down / avoid the noise for now.
Once the break happens, next you will look to play those positions towards the green horizontal support and Resistance levels to test for trend continuation.
Cheers! 🍺
🥇MLT | MAJOR LEAGUE TRADER

Head and shoulders on NetflixPropably right arm of Head and Shoulders, wuth neck line 400 USD. Target to 360 USD.

Nteflix Analysis for long termAs predicted on our last analysis of the Netflix action, the price made a downward trend, and rebound on the support.
therefore, We expect it to be increasing to reach the max M1.
However, we can expect also that the stock enters a zone of equilibrium.

NFLX: Potential New All Time Highs 1D (May 06)X Force Global Analysis:
In this analysis, we explore the technicals of Netflix (NFLX), the world's leading internet entertainment service, and arguably one of the biggest beneficiaries of the Corona Virus (Covid-19).
Analysis
- First of all, unlike most other blue chip stocks, we see a steady uptrend
- Counting Elliott Waves, we can count an Impulse Wave (12345) up, before a strong Corrective Wave count (ABC)
- This correction was not only a technical correction, but also one caused by the massive fear in the market due to the Corona Virus (Covid-19)
- After this correction, we can count Elliott Double Combo Waves (WXY)
- Wave W consists of a smaller double combo wave, and we are currently seeing wave X play out
- Within wave X, we can expect a corrective ABC wave, leading down to the trend line support marked by the dotted red line
- To support this, we see a death cross that has formed on the Moving Average Convergence Divergence (MACD), forming bearish histograms
- The Relative Strength Index (RSI) continues to create lower highs as well
- However, as the trend strength and momentum remain solid, we can expect a further impulsive move after a potential correction, leading us to new all time high levels
What We Believe
Netflix has been strong despite the fear in the market. The bullish momentum and trend strength remains, as Netflix strives to create record highs.
Trade Safe.


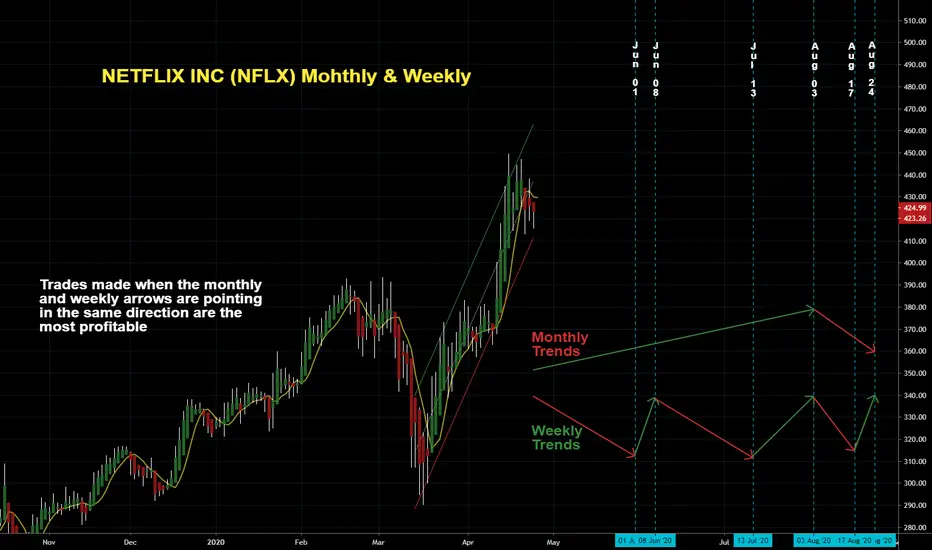
NETFLIX INC (NFLX) Mohthly & WeeklyDates in the future with the greatest probability for a price high or price low.
The Djinn Predictive Indicators are simple mathematical equations. Once an equation is given to Siri the algorithm provides the future price swing date. Djinn Indicators work on all charts, for any asset category and in all time frames. Occasionally a Djinn Predictive Indicator will miss its prediction date by one candlestick. If multiple Djinn prediction dates are missed and are plowed through by same color Henikin Ashi candles the asset is being "reset". The "reset" is complete when Henikin Ashi candles are back in sync with Djinn price high or low prediction dates.
One way the Djinn Indicator is used to enter and exit trades:
For best results trade in the direction of the trend.
The Linear Regression channel is used to determine trend direction. The Linear Regression is set at 2 -2 30.
When a green Henikin Ashi candle intersects with the linear regression upper deviation line (green line) and both indicators intersect with a Djinn prediction date a sell is triggered.
When a red Henikin Ashi candle intersects with the linear regression lower deviation line (red line) and both indicators intersect with a Djinn prediction date a buy is triggered.
This trading strategy works on daily, weekly and Monthly Djinn Predictive charts.
Trades made when the monthly and weekly arrows are pointing in the same direction are the most profitable.
This is not trading advice. Trade at your own risk.
Netflix Above the WedgeNetflix has broken above a wedge!
Currently sitting on top of a fib line
50MA can be seen to be rising
Looks good from TA perspective, however current market situation and economy is quite poor, with the coronavirus affecting the US.
Netflix is a great brand and has a great social standing
Risky buy


Netflix Possible BuyPossible buy on netflix
Users must be skyrocketing with everyone at home from the pandemic..
Included a bearish scenario
Using fib spirals still
Risky buy

Powerful Traders, everyday EWA's analysing & working process (b)Hello.
Everyday EWA's random training process is an important part for the experience & symbiosis with the Market.
Kind regards, Team Traders "Powerful Traders" netflix

Powerful Traders, everyday EWA's analysing & working process (a)Hello.
Everyday EWA's random training process is an important part for the experience & symbiosis with the Market.
Kind regards, Team Traders "Powerful Traders" netflix

NETFLIX reversed from resistance, potential drop!
NETFLIX reversed off its resistance at 320.36 where it could potentially drop further to 281.42.
Trading CFDs on margin carries high risk.
Losses can exceed the initial investment so please ensure you fully
understand the risks.

Elliott Wave View: Further Downside in NetflixShort term Elliott Wave view suggests the rally to $299.5 in Netflix ($NFLX) ended wave 2. From there, the stock resumed lower and ended wave 3 at $252.03. Internal of wave 3 unfolded as a 5 waves impulse Elliott Wave structure. Down from $299.5, wave ((i)) ended at $287.45 and wave ((ii)) bounce ended at $293.81. The stock extends lower and ended wave ((iii)) at $261.89, wave ((iv)) bounce ended at $266.60, and wave ((v)) of 3 ended at $252.03.
Wave 4 bounce i still in progress. Near term, while bounce stays below 299.54 expect Netflix to extend lower. We don’t like buying the stock.

NETFLIX NFLX stock long bias from weekly demand imbalanceYou don't really need a university career on economics to learn how to trade stocks like Netflix NFLX, you don't need to buy dozen of books on trading strategies, economics and fundamental analysis on how well a certain company has performed in the last quarter or in the last year. You can learn how to trade stocks like Netflix NFLX by simply locating the imbalances created in the underlying stock.
Since you won't be needing any Phd on economics, learning how to trade stocks using the supply and demand imbalances by professional traders will make it easier for you if you are new to trading, trading stocks for dummies we could call it.
We have a clear example of a strong imbalance of demand on NetFlix NFLX american stock. This particular stock has been dropping for weeks since it reached the $370 per share price level. There were opportunities to sell NetFlix stock when it was up there but now that price has reached a very strong demand imbalance on the weekly timeframe around $256, if you every sold NetFlix up there or on the way down, it's time to close your trade and take profit because we are expecting price to rally much higher as a reaction to that strong demand level on NetFlix weekly imbalance.
Let's hope price rallies much higher on NetFlix, similar imbalances have been created on many other american stocks. NetFlix forecast together with other american stocks are bullish and are creating very strong demand levels and even breaking all time highs over and over.
