Bulls Quit? Bears Ready! - Netflix Stock (USA) - {27/07/2025}Educational Analysis says that Netflix (USA Stock) may give trend Trading opportunities from this range, according to my technical analysis.
Broker - NA
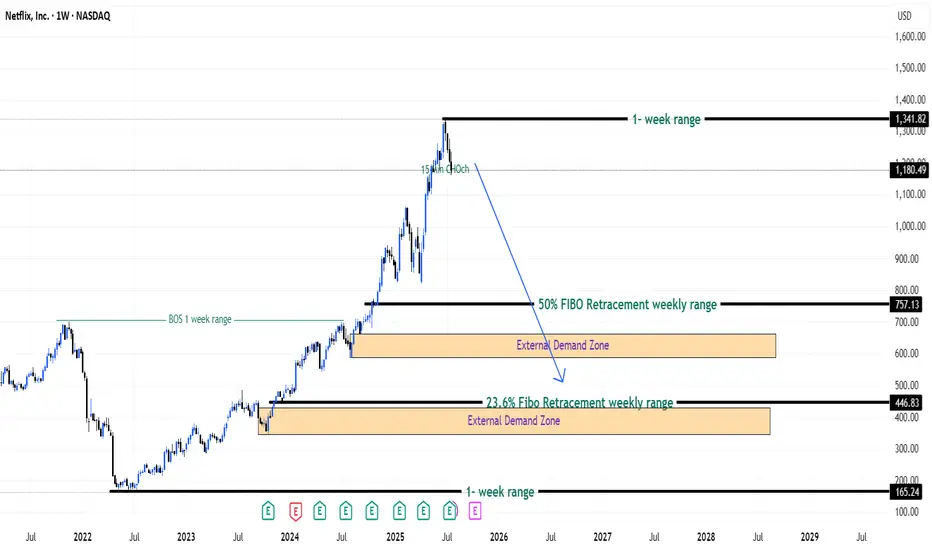
So, my analysis is based on a top-down approach from weekly to trend range to internal trend range.
So my analysis comprises of two structures: 1) Break of structure on weekly range and 2) Trading Range to fill the remaining fair value gap
Let's see what this Stock brings to the table for us in the future.
DISCLAIMER:-
This is not an entry signal. THIS IS FOR EDUCATIONAL PURPOSES ONLY.
I HAVE NO CONCERNS WITH YOUR PROFITS OR LOSS,
Happy Trading,
Stocks & Commodities TradeAnalysis.
My Analysis is:-
Short term trend may be go to the external demand zone.
Long term trend breaks the new high after going from discount zone.
Netflixsignal
Breaking: Netflix ($NFLX) Surges 3% Amidst Topping Q1 Earnings The shares of Netflix (NASDAQ: NASDAQ:NFLX ) is surging 3.5% in Friday's premarket session amidst Q1 earnings beat.
Netflix (NASDAQ: NASDAQ:NFLX ) reported first-quarter earnings that topped analysts’ expectations, sending shares higher in extended trading Thursday, extending the gains to Friday's premarket session.
The streaming giant's revenue grew over 12% YoY to $10.54 billion, above the analyst consensus from Visible Alpha. Net income of $2.89 billion, or $6.61 per share, rose from $2.33 billion, or $5.28 per share, a year earlier, beating Wall Street’s expectations. The period marked the first quarter Netflix did not report subscriber numbers.
Netflix's Gains Come as Subscription Prices Rise
The better-than-expected results came in part due to higher subscription and ad revenues, the company said, along with the timing of expenses.
Netflix had raised prices for its plans in January, hiking its ad-supported plan to $7.99 from $6.99 per month, the standard ad-free plan to $17.99 from $15.49 a month, and its premium plan to $24.99 from $22.99 a month.
Netflix maintained its fiscal 2025 revenue projection of $43.5 billion to $44.5 billion. Analysts on average had expected $44.27 billion. The company's second-quarter revenue forecast of $11.04 billion exceeded Wall Street's estimate of $10.91 billion.
Co-CEO Greg Peters said Netflix expects to double its advertising revenue this year, as the company rolls out its ad tech suite. The suite is live in the U.S. and Canada, with 10 other markets expected in the months to come.
Technical Outlook
As of the time of writing, NASDAQ:NFLX shares are up 3.29% in Friday's premarket session. NASDAQ:NFLX chart pattern has formed a perfect resistant and support point carved out since the 11th of November, 2024. Should NASDAQ:NFLX break the $1064 resistant point, a break out might be imminent for the entertainment giant.
Conversely, failure to break above that point could resort to a cool off to the $800 support point. NASDAQ:NFLX RSI is primed for a breakout as it is not oversold nor overbought but well positioned for a bullish move.

Netflix Eyes $1,200: Can It Break Key Levels to Soar Higher?Good morning, trading family!
Netflix (NFLX) is looking exciting right now, and here’s what I’m watching:
-If we drop below $973, we might see $950 support come into play.
-But if we break above $991, there’s potential for a rally to $1,055 and higher—with $1,200 as the ultimate goal.
Big moves could be coming, so keep these levels on your radar!
If this analysis helped you, I’d love to hear your thoughts. Drop a comment, give it a like, or share with others. Let’s trade smarter and live better!
Kris/Mindbloome Exchange
Trade What You See

Netflix Stock Up 14% Premarket Following Record-Breaking QuarterNetflix Inc. ( NASDAQ:NFLX ) is making headlines with a significant 14% surge in premarket trading, fueled by the company’s record-breaking fourth-quarter performance. This milestone, driven by live sports programming and the return of its flagship series, *Squid Game*, marks a pivotal moment for the streaming giant. Here’s an in-depth look at the technical and fundamental aspects behind this remarkable rally.
Record Subscriber Growth
Netflix added an unprecedented 18.9 million subscribers in Q4 2024, bringing its global subscriber base to over 300 million. This growth, more than double Wall Street’s expectations, surpasses the company’s previous record of 15 million new subscribers in Q1 2020. Notably, this quarter marked the final time Netflix will report subscriber numbers, signaling a shift toward emphasizing financial metrics such as revenue and profit.
Revenue and Profit Surge
Netflix reported a 16% year-over-year increase in revenue, reaching $10.2 billion for the quarter—its most substantial growth since 2021. For 2025, the company projects revenue of up to $44.5 billion, a 14% increase, with an operating margin of 29%. These robust financials underscore the company’s ability to sustain growth amidst a competitive streaming landscape.
Key Drivers of Growth
1. Live Programming: Netflix’s venture into live sports, including its first major National Football League games and the Jake Paul vs. Mike Tyson boxing match, has proven to be a game-changer. These events attracted record sign-ups, highlighting the potential of live programming to drive subscriber growth.
2. Content Strategy: The return of Squid Game and the success of the hit movie Carry-On further bolstered subscriber numbers. Netflix’s diverse programming mix ensures broad audience appeal, while no single title dominated subscriber additions.
3. Password Sharing Crackdown: The company’s crackdown on password sharing contributed to its best-ever year for subscriber growth, with 41 million new customers added in 2024.
4. Advertising Revenue: While still in its early stages, Netflix’s advertising business is gaining traction. A majority of new subscribers in markets with ad-supported tiers opted for this model, signaling growing acceptance of ad-supported streaming.
Price Increases
Netflix is boosting prices across several markets, including the U.S., Canada, Portugal, and Argentina. The most popular U.S. plan now costs $17.99 per month, a $2.50 increase. These price hikes are expected to contribute significantly to revenue growth in 2025.
Market Reaction
Netflix shares closed at $869.68 in New York on Tuesday and are set to open with a 14% gain in premarket trading. If sustained, this would mark the stock’s most significant gain since October 2023.
Technical Analysis
As of premarket trading, NASDAQ:NFLX is up 14.70%, reflecting bullish sentiment driven by the record-breaking quarterly performance. The Relative Strength Index (RSI) was at 48.99 before this surge, indicating the stock was neither overbought nor oversold.
Bullish Gap-Up Pattern
The premarket rally sets the stage for a potential gap-up pattern at market open. This technical phenomenon occurs when a stock’s opening price is significantly higher than its previous closing price. Historically, gap-ups are strong bullish indicators, often followed by brief pullbacks as traders digest the news.
Resistance and Support Levels
- Resistance: The stock is eyeing its one-month high as the next resistance level. A breakout above this point could trigger further bullish momentum.
- Support: Immediate support lies at the $776 level. A breakdown below this level could lead to a retest of lower support zones, but this scenario appears less likely given the current bullish momentum.
Market Outlook
With the broader stock market expected to rally following Donald Trump’s inauguration earlier this week, NASDAQ:NFLX is poised to capitalize on favorable market conditions. The combination of strong fundamentals and bullish technical indicators suggests a continued upward trajectory in the near term.
Conclusion
Netflix’s record-breaking quarter underscores its resilience and adaptability in an evolving streaming landscape. The company’s strategic focus on live programming, diverse content offerings, and advertising is paying off, driving subscriber growth and revenue to new heights. From a technical perspective, the stock’s premarket surge and bullish patterns point to a strong start for 2025.
As Netflix pivots toward prioritizing financial metrics over subscriber numbers, investors have much to look forward to in terms of sustained growth and profitability. With NASDAQ:NFLX setting the stage for a historic year, the streaming giant remains a compelling investment opportunity for traders and long-term investors alike.

NETFLIX’s Next Big Move: Massive Breakout Imminent?Technical Analysis:
NFLX (Netflix), on the 15-minute time frame, has set up a long trade with a strong entry at $744.60, supported by good volume. The breakout occurred above a consolidation phase, indicating market interest in a bullish move.
The price action is holding above the entry level, and the Risological Dotted Trendline is trending upward, providing a strong support foundation for the trade. This long setup points to a potential bullish continuation as Netflix approaches the following targets.
Key Levels:
Entry: $744.60
Stop Loss (SL): $715.10
Target 1 (TP1): $781.07
Target 2 (TP2): $840.08
Target 3 (TP3): $899.09
Target 4 (TP4): $935.56
Observations:
The breakout was backed by strong volume, reflecting confidence from the bulls.
Price is consolidating near TP1, suggesting momentum is building for further upside.
The Risological Dotted Trendline is trending upwards, giving strong support around $744, ensuring the trend stays intact.
Outlook:
Netflix's long trade setup shows strong potential for upward movement. With the support of the Risological Dotted Trendline and high volume backing, this trade is well-positioned to meet its targets. Watch for any pullback near $740, which could present another opportunity to re-enter or add to positions.

NFLX ( Netflix ) SELL TF M15 TP = 631.71On the M15 chart the trend started on Aug. 20 (linear regression channel).
There is a high probability of profit taking. Possible take profit level is 631.71
Using a trailing stop is also a good idea!
Please leave your feedback, your opinion. I am very interested in it. Thank you!
Good luck!
Regards, WeBelievelnTrading

Netflix (NFLX) Analysis: Multi-Timeframe PerspectiveA More Detailed analysis on Netflix (NFLX) from a Multi-Timeframe Perspective.
Check out my other analysis for a detailed explanation on this video

NFLXPair : NFLX - Netflix
Description :
Completed " 12345 " Impulsive Waves
Break of Structure
RSI - Divergence
Bullish Channel as an Corrective Pattern in Short Time Frame
Resistance Level

NFLXPair : Netflix - NFLX
Description :
RSI - Divergence
Demand Zone
Rising Wedge as an Corrective Pattern in Short Time Frame with the Breakout of the Lower Trend Line and Retracement
Break of Structure
Completed " 12345 " Impulsive Waves

NFLXPair : NFLX - Netflix
Description :
Double Top
Resistance Level
Completed " 12345 " Impulsive Waves
Impulse Corrective
Break of Structure
CHoCH

NFLX is setting up for another gap down open next weekNFLX is setting up for another gap down open next week
Quite bearish action here, no longs for me until Jan gap close is closed

NETFLIX long run!Shares of Netflix Inc. NFLX, -1.01% slid 1.01% to $607.33 Thursday, on what proved to be an all-around great trading session for the stock market, with the S&P 500 Index SPX, +0.11% rising 0.11% to 5,254.35 and the Dow Jones Industrial Average DJIA, +0.12% rising 0.12% to 39,807.37.
This was the stock's second consecutive day of losses.
Netflix Inc. closed $27.06 short of its 52-week high ($634.39), which the company achieved on March 26th.
The stock demonstrated a mixed performance when compared to some of its competitors Thursday, as Apple Inc. AAPL, -1.06% fell 1.06% to $171.48, Walt Disney Co. DIS, +1.14% rose 1.14% to $122.36, and Comcast Corp. Cl A CMCSA, +0.65% rose 0.65% to $43.35.
Trading volume (3.7 M) remained 932,558 below its 50-day average volume of 4.6 M.

NFLX Jan 26th Update, Target got hitWe had a great bull flag setup going into the earnings.
Now the target got hit, will be watching for a retracement into early Feb and another push higher into Feb OPEX
Nothing bearish here to even try taking a short trade. There is still one more gap to close above the price, should be hit first before reversal starts.
Also the price might just consolidate/correct in time and push above to a new high. Any shorting should have solid stops

NFLX / 1H / TECHNICAL ANALYSIS NASDAQ:NFLX I expect a bullish movement towards the 518 level if the resistance zone at the 503 level is breached and there are candlestick closures. Our support level is at 461.
Like and comment if you find value in our analysis.
Feel free to post your ideas and questions at the comments section.
Good luck

[EN] Netflix at all-time highs // GaliortiTrading NASDAQ:NFLX in late July attacked the 61.8% Fibonacci of the entire previous decline since November 2021 . It pulled back to its liquidity zone between $370-385 from which it has made a new impulse. Final target: new all-time highs .
1 M
On a long term chart we note that NASDAQ:NFLX in July 2022 rested on its bullish trendline to develop a new bullish leg . Its final target for the next few years would be around $2,000.
1 W
In the shorter term on a weekly chart we observe that NASDAQ:NFLX is developing a symmetrical triangle that is highly likely to break to the upside . The minimum target for such a breakout would take it to around $580 . It should be remembered that the first obstacle after that breakout will be the 61.8% Fibonacci ($492) so it is likely to make a pull-back to the breakout line. In addition, the bearish gap from the end of July will be a resistance to be taken into account.
The 470-495$ is a great liquidity zone that will allow it to perform a new bullish wave with a first target at 580$ (target of the broken triangle) and a second target at new all-time highs.
1 D
The company's third quarter results have led to a large bullish gap with a large volume (the second largest of the year), this translates a great strength as demonstrated by the verticality of the rise. It is logical that in the coming days there could be a correction as prices hit the medium-term downtrend line . It will be a healthy and necessary correction to develop a new momentum that will allow it to definitively leave the 61.8% Fibonacci level .
Pablo G.

Netflix to breakdown?Netflix - 30d expiry - We look to Sell a break of 410.77 (stop at 430.77)
We are trading at overbought extremes.
485 has been pivotal.
Prices have reacted from 485.
Short term bias has turned negative.
Short term momentum is bearish. 411.50 has been pivotal.
A break of the recent low at 411.50 should result in a further move lower.
The bias is to break to the downside.
Our profit targets will be 360.77 and 350.77
Resistance: 430.00 / 445.00 / 455.00
Support: 411.50 / 390.00 / 370.00
Please be advised that the information presented on TradingView is provided to Vantage (‘Vantage Global Limited’, ‘we’) by a third-party provider (‘Everest Fortune Group’). Please be reminded that you are solely responsible for the trading decisions on your account. There is a very high degree of risk involved in trading. Any information and/or content is intended entirely for research, educational and informational purposes only and does not constitute investment or consultation advice or investment strategy. The information is not tailored to the investment needs of any specific person and therefore does not involve a consideration of any of the investment objectives, financial situation or needs of any viewer that may receive it. Kindly also note that past performance is not a reliable indicator of future results. Actual results may differ materially from those anticipated in forward-looking or past performance statements. We assume no liability as to the accuracy or completeness of any of the information and/or content provided herein and the Company cannot be held responsible for any omission, mistake nor for any loss or damage including without limitation to any loss of profit which may arise from reliance on any information supplied by Everest Fortune Group

Netflix Ventures into Video Game Streaming: A Game-Changer in th
Introduction:
We are calling all savvy traders! Brace yourselves for a groundbreaking announcement that has the potential to reshape the entertainment industry as we know it. Netflix, the streaming giant that has revolutionized the way we consume movies and TV shows, is now stepping into the realm of video game streaming. This exciting move will diversify Netflix's offerings and open up a world of opportunities for the company and its loyal subscribers.
The Game-Changing Leap:
Netflix's decision to enter the video game streaming market signifies a strategic shift that promises to captivate gamers and entertainment enthusiasts. With a vast user base of over 200 million subscribers worldwide, the platform's foray into gaming is poised to disrupt the industry and create a new era of immersive entertainment experiences.
Why This Matters:
By expanding its services to include video game streaming, Netflix is tapping into a multi-billion-dollar market, further solidifying its dominant force in the entertainment industry. This move diversifies their revenue streams and enhances their competitive edge, enticing new subscribers and keeping existing ones engaged for extended periods.
The Netflix Advantage:
What sets Netflix apart from traditional gaming platforms is its ability to leverage its vast content library and recommendation algorithms to curate personalized gaming experiences. Imagine a world where Netflix recommends movies and TV shows and suggests video games tailored to your preferences. This integration of gaming into their existing ecosystem creates a seamless and immersive user experience, making Netflix an all-in-one entertainment hub.
The Call-to-Action:
As traders, it's crucial to recognize the immense potential that Netflix's entry into video game streaming brings. This exciting move will drive the company's growth and create new investment opportunities. By diversifying its offerings, Netflix is positioning itself for long-term success and continued innovation.
So, don't miss out on this game-changing opportunity! Keep a close eye on Netflix's journey into video game streaming and consider adding it to your investment portfolio. Stay informed, analyze the market trends, and seize the potential rewards that lie ahead as Netflix continues to redefine the boundaries of entertainment.
Conclusion:
Netflix's decision to venture into video game streaming is a bold and exciting move that has the potential to revolutionize the entertainment landscape. By diversifying their offerings, the streaming giant is primed to captivate a broader audience, enhance user engagement, and create new avenues for growth. As traders, it's essential to recognize the significance of this move and stay ahead of the curve. So, gear up for a thrilling ride as Netflix transforms the way we play and stream, and seize the opportunity to long Netflix as they embark on this exhilarating journey into the world of video game streaming.

Netflix Overbought and Facing Resistance Netflix NASDAQ:NFLX
EARNINGS RELEASE TODAY (AFTER THE CLOSE)
Entry Pending Until:
- Break above overhead resistance, making it support
- A revisit of the 200 Day SMA
- In both, tight stop required
We are currently oversold on the RSI and whilst the stock could remain oversold for weeks the last 2 times we reached this exact RSI level we were rejected. For this reason I see no reason to be rushing into this trade. If you put on a trade you need a tight tight stop loss.
The head and shoulders pattern could take another year to play out. For the moment I am focused on the immediate resistance overhead, the overbought RSI signal and the 200 SMA.
Its amazing we don't see more Netflix in feeds, we are up 200% over the past 12 month period.
Hope this helps anyone trying to build a structure of the chart for a potential play.
PUKA

Short-term top of NFLX has already appearedShort-term top of NFLX has already appeared
This chart shows the weekly candle chart of Netflix's stock over the past year. The graph overlays the recent bottom-up golden section. As shown in the figure, the recent high point of Netflix's stock is exactly 3.618 on the golden section in the figure! The weekly pattern of Naifei stock last week showed a very long up shadow, indicating that the short-term top has already appeared, and the probability of maintaining a relatively high level of major volatility consolidation in the future is likely to be maintained!

NFLX ANALYSISAfter the filling and rejection of the gap left by the market in the bullish trend we will see a reversal to fill the gap of the dump of the price
- ''GAP'' is a better trading opportunity take advantage of it
- Trading is probality control you risk management
Good Luck !

Netflix NFLX Next MovePair : NFLX ( Netflix )
Description :
Bearish Channel in Long Time Frame as an Corrective Pattern with the Breakout of the Lower Trend Line and Retracement
Break of Structure
RSI - Divergence
Completed " ABC " Corrective Wave
Bearish Channel in STF with the Breakout of the UTL need to wait until it Completed its Retest
Impulse Correction Impulse

Netflix - SHORT (54% profit) / where to buy (NEW)In May 2022 Netflix has hit lows seen last time in September 2017.
Since then NFLX has been on a steady rise. It looks like the price is in some kind of a rising channel.
Indicators such as MACD or RSI are implying more upside in the next weeks. It looks good for bulls. Around $380 we may see a rejection as it's a huge resistance now. We expect bears to take over from there and the downtrend to resume. If the price drops 54 % from there we could see a potential higher low /double bottom which would be mega bullish and would help bulls to confirm the long-term uptrend.
-Short at the strong resistance
-exit for shorts / buy area: $177 - $170
Most likely it will take many months for a price to reach a buy area therefore patience is required .
Good luck

Netflix and Chill?I see price retesting the recently broken trendline, if the sell volume is high then we may see a continuation of a downtrend.
