Bulls Quit? Bears Ready! - Netflix Stock (USA) - {27/07/2025}Educational Analysis says that Netflix (USA Stock) may give trend Trading opportunities from this range, according to my technical analysis.
Broker - NA
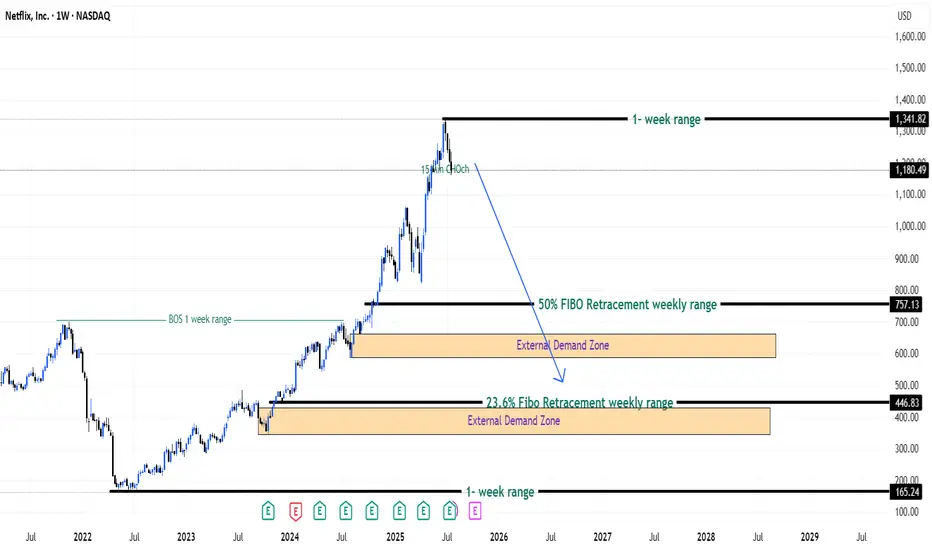
So, my analysis is based on a top-down approach from weekly to trend range to internal trend range.
So my analysis comprises of two structures: 1) Break of structure on weekly range and 2) Trading Range to fill the remaining fair value gap
Let's see what this Stock brings to the table for us in the future.
DISCLAIMER:-
This is not an entry signal. THIS IS FOR EDUCATIONAL PURPOSES ONLY.
I HAVE NO CONCERNS WITH YOUR PROFITS OR LOSS,
Happy Trading,
Stocks & Commodities TradeAnalysis.
My Analysis is:-
Short term trend may be go to the external demand zone.
Long term trend breaks the new high after going from discount zone.
Netflixstock
How Earnings Reporting Could Impact Netflix (NFLX) Share PriceHow Earnings Reporting Could Impact Netflix (NFLX) Share Price
Earnings season is gaining momentum. Today, after the close of the main trading session, Netflix (NFLX) is set to release its quarterly financial results.
Analysts are optimistic, forecasting earnings per share (EPS) of $7.08, up from $4.88 a year earlier, and revenue growth to $11.1 billion.
The upbeat sentiment is driven by:
→ the fact that Netflix’s business model is relatively resilient to tariff-related pressures;
→ the company’s success in curbing password sharing and promoting a more affordable ad-supported subscription tier.
Netflix has reported revenue growth for six consecutive quarters, outperforming competitors such as Disney, Amazon, and Apple. Its market share has climbed to 8.3%, with YouTube remaining its only serious rival—YouTube's share increased from 9.9% a year ago to 12.8% in June, according to Nielsen. If current trends hold, this reporting quarter could mark another strong performance for Netflix.
However, is the outlook truly that bullish?
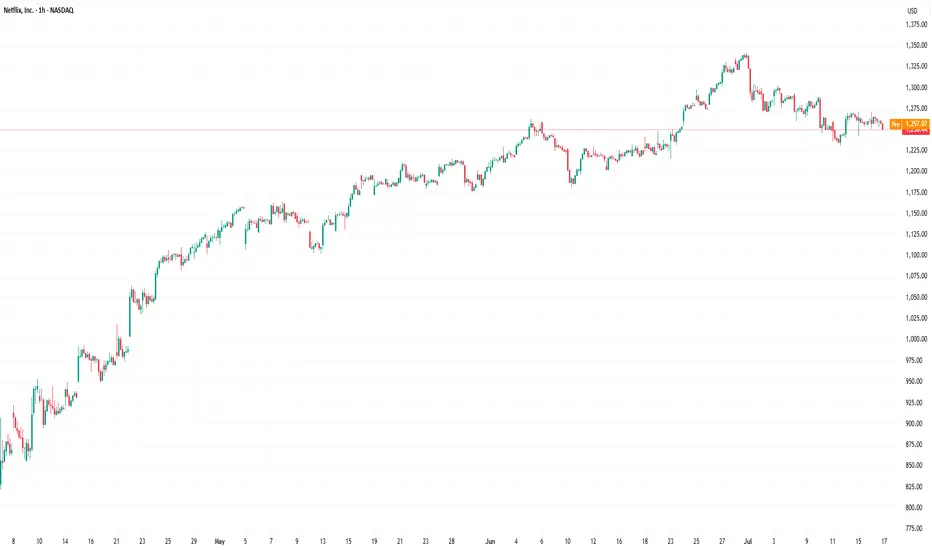
Technical analysis of NFLX stock chart
The NFLX stock price is currently moving within an ascending channel (marked in blue), and it is now testing the lower boundary of this formation. Of concern is the recent pronounced bearish movement (B), which has dragged the stock from the channel’s upper boundary to its lower edge—erasing the bullish momentum (A) that followed the breakout above the $1,250 resistance level.
What’s next?
→ On the one hand, bulls may attempt to resume the upward trend within the channel.
→ On the other hand, bears could build on their recent momentum (highlighted in red) and break the ascending trend that has been in place since May.
It appears the fate of the current uptrend hinges on the market’s reaction to today’s earnings release.
This article represents the opinion of the Companies operating under the FXOpen brand only. It is not to be construed as an offer, solicitation, or recommendation with respect to products and services provided by the Companies operating under the FXOpen brand, nor is it to be considered financial advice.
Netflix (NFLX) Share Price Reaches Record HighNetflix (NFLX) Share Price Reaches Record High
According to the charts, Netflix (NFLX) shares have risen above $1,170 – the highest level in the company’s history. Since the start of 2025, the price of NFLX stock has increased by approximately 33%, while the S&P 500 index (US SPX 500 mini on FXOpen) remains close to its opening levels from 2 January.
Why Is Netflix (NFLX) Performing Strongly?
A month ago, we highlighted several factors contributing to NFLX’s outperformance relative to the broader stock market. Among them is the fact that Netflix does not offer tradable goods subject to tariffs in trade wars. As a result, the company could potentially benefit from an economic downturn if consumers spend more time at home.
According to recent reports:
→ Netflix has announced that 94 million subscribers are now using its low-cost ad-supported plan – a figure more than a third higher than the 70 million reported in November.
→ The company also forecasts that advertising revenue will double this year.
Technical Analysis of the NFLX Share Chart
The share price continues to move within the upward channel (shown in blue) we identified previously. At the same time:
→ the price is currently near the upper boundary of this channel, which has repeatedly acted as resistance (as indicated by arrows);
→ the RSI indicator shows a potential bearish divergence.
Under these conditions, a corrective move in Netflix’s stock price cannot be ruled out – for example, towards line Q or the channel median.
This article represents the opinion of the Companies operating under the FXOpen brand only. It is not to be construed as an offer, solicitation, or recommendation with respect to products and services provided by the Companies operating under the FXOpen brand, nor is it to be considered financial advice.

Netflix (NFLX) Share Price Jumps Nearly 5%Netflix (NFLX) Share Price Jumps Nearly 5%
According to the charts, Netflix (NFLX) shares rose to their highest level since early April, while the S&P 500 index (US SPX 500 mini on FXOpen) declined by approximately 0.2% yesterday.
Since the beginning of 2025, NFLX’s share price has increased by more than 8%, showing resilience in a volatile stock market that remains sensitive to the escalation of the global trade war.
Why Is Netflix (NFLX) Gaining in Value?
The strong performance may be attributed to three key factors:
Jason Helfstein, an analyst at financial holding company Oppenheimer, believes the company likely faces “limited” risks. Netflix does not sell tradeable goods subject to tariffs and could even benefit from a potential economic downturn if consumers opt to stay home more often.
According to The Wall Street Journal, Netflix has set a target of reaching a market capitalisation of $1 trillion and doubling its revenue to $39 billion by 2030.
Positive sentiment ahead of the earnings report – yes, Netflix is one of the first to release its quarterly results.
Technical Analysis of NFLX Share Chart
The share price is moving within an upward channel (shown in blue), with strong support in 2025 provided by both the lower boundary of the channel and the $840 level – a level originating from the powerful rally at the end of 2024.
On the other hand, the price has now approached the psychological $1000 level. It is possible that, in light of the upcoming earnings release (scheduled for tomorrow, 17 April), the bulls may attempt a breakout and aim to secure a foothold in the upper half of the channel.
This article represents the opinion of the Companies operating under the FXOpen brand only. It is not to be construed as an offer, solicitation, or recommendation with respect to products and services provided by the Companies operating under the FXOpen brand, nor is it to be considered financial advice.

Netflix: New All-time High!As expected, Netflix reached a new all-time high at $1,067, completing the magenta wave . Since then, the stock has already pulled back by nearly 20%. The ongoing magenta wave should extend further into our new magenta Target Zone, which spans $789.04 to $704.43. Since we anticipate a sustainable rebound from this range, it presents an opportunity to initiate or expand long positions. Such long entries could be hedged with a stop 1% below the Zone’s lower boundary, as there is a 30% chance that Netflix will drop below the Zone to complete the green wave alt. .

Netflix Crushes It Again as Shares Near $1,000. Where Rivals At?The smash-hit nail-biting Korean drama Squid Game, French mystery thriller Lupin or VR-infused 3 Body Problem. These are all Netflix Original titles that take us out of the ordinary and into a whirlwind of sensations and visual and emotional excess.
Only that we can have those sensations IRL thanks to the hype train called Netflix stock NFLX — the streaming pioneer schleps us on wild gyrations across the chart — sometimes super scary but sometimes unbelievably good. This time it was the latter.
“I can’t hear you over the sounds of ♫ RING-A-RING-A-RING ♫ blasting out of the speakers of more than 68 million viewers” — Netflix to its competition, probably, as it reported a bombastic quarter with a record number of subscribers.
The very-fabulous, bumper three months to December picked up 19 million paid users (how many of these were day trading while binging?) as Squid Gain Game dialed up more than 68 million views in its first week. The other big hit, Jake Paul vs Mike Tyson boxing live, whipped up 65 million streams.
It was also the perfect quarter to end the practice of reporting subscriber growth. Starting with the current three months to March, the streaming platform won’t be announcing how many new users are onboarded as it shifts the focus to traditional financial metrics like revenue growth and profits.
The shares soared as much as 15% in after-hours activity following the earnings report. They opened for regular trading on Wednesday and hit an all-time session high of $999 a piece. On the way, Netflix crossed a $400 billion valuation.
Here’s a quick rundown of the numbers for the fourth quarter:
Earnings per share: $4.27 vs. $4.20 expected
Revenue: $10.25 billion vs. $10.11 billion expected
Total paid memberships: 301.63 million vs. 290.9 million expected
It was the tech titan’s seventh consecutive quarter of rising profits, up 27% from the year-ago period. Looking ahead, Netflix plans to spend $18 billion on new content in 2025 while revenue is expected to be between $43.5 billion and $44.5 billion, up 14% from last year. Operating margin is projected to hit 29%.
Besides ads, one other thing is supposed to help Netflix get to its lofty guidance — price hikes. The streaming platform will be asking for more cash in the US, Canada, Portugal and Argentina. Here’s what’s changing in the US:
Ad-tier $6.99 > $7.99/mo.
Standard $15.49 > $17.99/mo.
Premium $22.99 > $24.99/mo.
“We’re fortunate that we don’t have distractions like managing declining linear networks and, with our focus and continued investment, we have good and improving product/market fit around the world,” the company said in its earnings report Tuesday.
“We enter 2025 with strong momentum, coming off a year with record net (subscriber) additions and having re-accelerated growth,” it added.
Where’s the competition at? Let’s look at Disney DIS , the closest rival. Disney expects to spend about $24 billion on new content in 2025, up from $23.4 billion. Yet it has about half the subscribers of Netflix — around 154 million.
Other prominent contenders in the streaming war are not even close — Apple AAPL and Amazon AMZN . Apple doesn’t disclose Apple TV+ subscribers and Amazon doesn’t disclose Prime subscribers.
Third-party estimates point to about 50 million to 75 million Apple TV+ users. Amazon Prime, which is tied to the ecommerce platform’s delivery service, has about 200 million customers.
But let’s give it to them — Apple and Amazon have got a bunch of diversified revenue streams, while Netflix has stuck to its OG mission of being a streaming platform.
In any case, this streaming war is not over, so it's worth keeping an eye on company updates and reports in the earnings calendar . (Hint: Disney earnings arrive February 5.)
Where do you think the streaming wars are headed in 2025? Share your thoughts on Netflix, Disney, and the rest in the comments!

NFLXPair : NFLX - Netflix
Description :
Completed " 12345 " Impulsive Waves
Break of Structure
RSI - Divergence
Bullish Channel as an Corrective Pattern in Short Time Frame
Resistance Level

NFLXPair : Netflix - NFLX
Description :
RSI - Divergence
Demand Zone
Rising Wedge as an Corrective Pattern in Short Time Frame with the Breakout of the Lower Trend Line and Retracement
Break of Structure
Completed " 12345 " Impulsive Waves

NFLXPair : NFLX - Netflix
Description :
Double Top
Resistance Level
Completed " 12345 " Impulsive Waves
Impulse Corrective
Break of Structure
CHoCH

Short-term top of NFLX has already appearedShort-term top of NFLX has already appeared
This chart shows the weekly candle chart of Netflix's stock over the past year. The graph overlays the recent bottom-up golden section. As shown in the figure, the recent high point of Netflix's stock is exactly 3.618 on the golden section in the figure! The weekly pattern of Naifei stock last week showed a very long up shadow, indicating that the short-term top has already appeared, and the probability of maintaining a relatively high level of major volatility consolidation in the future is likely to be maintained!

Netflix: Are you still watching…? 👀Well, the question should rather be: “Are you still climbing?” Indeed, Netflix still has got some room left to expand wave 1 in turquoise further upwards, although the next top can be placed anytime now as well. As soon as this is done and dusted, the share should turn downwards to develop wave 2 in turquoise before the next stage of ascent can start. However, there is a 34% chance that Netflix could continue to climb higher than primarily anticipated. In that case, we would expect the share to already develop wave alt.3 in turquoise, meaning that wave alt.1 and alt.2 in turquoise would be finished by now.

Netflix NFLX Next MovePair : NFLX ( Netflix )
Description :
Bearish Channel in Long Time Frame as an Corrective Pattern with the Breakout of the Lower Trend Line and Retracement
Break of Structure
RSI - Divergence
Completed " ABC " Corrective Wave
Bearish Channel in STF with the Breakout of the UTL need to wait until it Completed its Retest
Impulse Correction Impulse

Netflix: Bringing It on Stream 🎞Netflix has brought wave b in magenta on stream quite commendably and has already touched at the gray zone between $343.40 and $359.13. Thus, wave b in magenta could be finished by now, although the share could just as well use the remaining room in the upper part of the gray zone to place the corresponding high. As soon as this is done, the course should turn and head for the turquoise zone between $271.07 and $209.09 to develop wave B in turquoise. Afterward, Netflix should tackle the resistance at $379.43, which should then be conquered by wave C in turquoise. However, we should still keep in mind the 35% chance that the stock could break through the turquoise zone and drop below the support at $162.75.

NETFLIXYou can see NETFLIX is at the resistance box, I'd say it won't break it and it will go to 184$ nPOC, VAL level is the last support and below it we are looking for NTFLX to hit 140-150$ nPOC, there we can expect bounce.

NFLX Netflix: 1D Chart ReviewHello friends, today you can review the technical analysis idea on a 1D linear scale chart for Netflix, Inc. (NFLX).
The chart is self-explanatory. Death cross may be coming up. RSI just broke out of the support line. Keep an eye on the Support Zone.
Included in the chart: Trend line, Support and Resistance Lines, RSI, MFI, Death Cross, Simple Moving Average, EMA Ribbons, Volume.
If you enjoy my ideas, feel free to like it and drop in a comment. I love reading your comments below.
I have additional charts below on cryptocurrencies, stocks and more to review. Check them out!
Disclosure: This is just my opinion and not any type of financial advice. I enjoy charting and discussing technical analysis . Don't trade based on my advice. Do your own research! #cryptopickk

Netflix in More Trouble? Netflix - Short Term - We look to Sell at 358.64 (stop at 378.80)
Preferred trade is to sell into rallies. Previous support, now becomes resistance at 360.00. The primary trend remains bearish. The bias is still for lower levels and we look for any gains to be limited.
Our profit targets will be 291.27 and 281.07
Resistance: 360.00 / 400.00 / 450.00
Support: 300.00 / 290.00 / 250.00
Disclaimer – Saxo Bank Group. Please be reminded – you alone are responsible for your trading – both gains and losses. There is a very high degree of risk involved in trading. The technical analysis, like any and all indicators, strategies, columns, articles and other features accessible on/though this site (including those from Signal Centre) are for informational purposes only and should not be construed as investment advice by you. Such technical analysis are believed to be obtained from sources believed to be reliable, but not warrant their respective completeness or accuracy, or warrant any results from the use of the information. Your use of the technical analysis, as would also your use of any and all mentioned indicators, strategies, columns, articles and all other features, is entirely at your own risk and it is your sole responsibility to evaluate the accuracy, completeness and usefulness (including suitability) of the information. You should assess the risk of any trade with your financial adviser and make your own independent decision(s) regarding any tradable products which may be the subject matter of the technical analysis or any of the said indicators, strategies, columns, articles and all other features.
Please also be reminded that if despite the above, any of the said technical analysis (or any of the said indicators, strategies, columns, articles and other features accessible on/through this site) is found to be advisory or a recommendation; and not merely informational in nature, the same is in any event provided with the intention of being for general circulation and availability only. As such it is not intended to and does not form part of any offer or recommendation directed at you specifically, or have any regard to the investment objectives, financial situation or needs of yourself or any other specific person. Before committing to a trade or investment therefore, please seek advice from a financial or other professional adviser regarding the suitability of the product for you and (where available) read the relevant product offer/description documents, including the risk disclosures. If you do not wish to seek such financial advice, please still exercise your mind and consider carefully whether the product is suitable for you because you alone remain responsible for your trading – both gains and losses.

Netflix Analysis 11.02.2022Hello Traders,
welcome to this free and educational analysis.
I am going to explain where I think this asset is going to go over the next few days and weeks and where I would look for trading opportunities.
If you have any questions or suggestions which asset I should analyse tomorrow, please leave a comment below.
I will personally reply to every single comment!
If you enjoyed this analysis, I would definitely appreciate it, if you smash that like button and maybe consider following my channel.
Thank you for watching and I will see you tomorrow!

Netflix: Great opportunity to buy the dipAfter a huge gap, investors such as Bill Ackman even the CEO of Netflix are buying the dip in this strong support line in all extreme oversold levels. We expect the price to recover if there are no bigger corrections on the main indices. Netflix is experiencing less growth due to higher competition but the company still has good numbers. It's a buy and hold.


$NFLX PRE-EARNINGS RUN UP? Video breakdown on $NFLX going into January 2021! Thank you you all and happy new year!
