Netflix (NFLX) Share Price Jumps Nearly 5%Netflix (NFLX) Share Price Jumps Nearly 5%
According to the charts, Netflix (NFLX) shares rose to their highest level since early April, while the S&P 500 index (US SPX 500 mini on FXOpen) declined by approximately 0.2% yesterday.
Since the beginning of 2025, NFLX’s share price has increased by more than 8%, showing resilience in a volatile stock market that remains sensitive to the escalation of the global trade war.
Why Is Netflix (NFLX) Gaining in Value?
The strong performance may be attributed to three key factors:
Jason Helfstein, an analyst at financial holding company Oppenheimer, believes the company likely faces “limited” risks. Netflix does not sell tradeable goods subject to tariffs and could even benefit from a potential economic downturn if consumers opt to stay home more often.
According to The Wall Street Journal, Netflix has set a target of reaching a market capitalisation of $1 trillion and doubling its revenue to $39 billion by 2030.
Positive sentiment ahead of the earnings report – yes, Netflix is one of the first to release its quarterly results.
Technical Analysis of NFLX Share Chart
The share price is moving within an upward channel (shown in blue), with strong support in 2025 provided by both the lower boundary of the channel and the $840 level – a level originating from the powerful rally at the end of 2024.
On the other hand, the price has now approached the psychological $1000 level. It is possible that, in light of the upcoming earnings release (scheduled for tomorrow, 17 April), the bulls may attempt a breakout and aim to secure a foothold in the upper half of the channel.
This article represents the opinion of the Companies operating under the FXOpen brand only. It is not to be construed as an offer, solicitation, or recommendation with respect to products and services provided by the Companies operating under the FXOpen brand, nor is it to be considered financial advice.
Netflixtrading

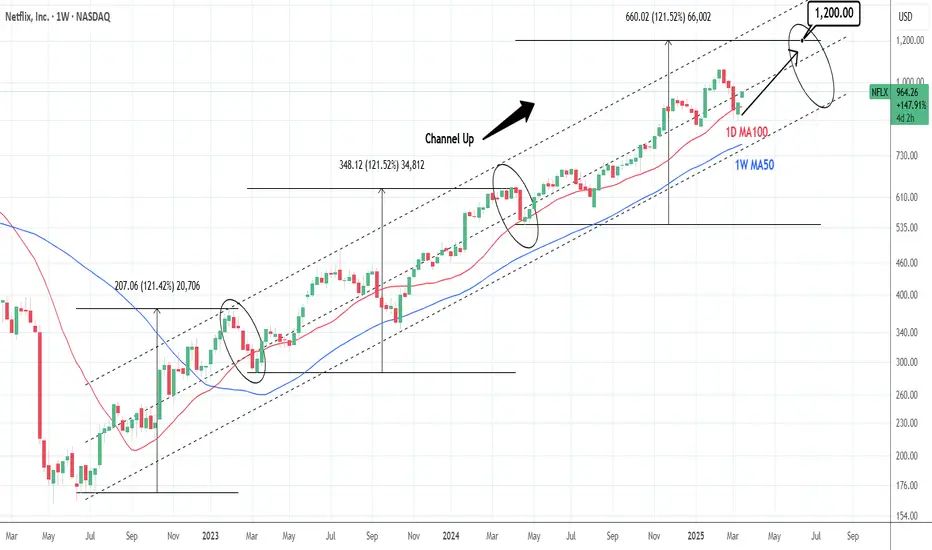
NETFLIX: Strong buy opportunity with this 1D MA100 bounce.Netflix is neutral on its 1D technical outlook (RSI = 52.399, MACD = -10.400, ADX = 30.636) and is rebounding on the 1D MA100. This is another HL on the 20 month Channel Up, which should be enough to give the stock a push to a new HH. The Channel Up is on its 3rd main bullish wave and both prior saw a +121.52% price increase. We expect the 3rd one to be completed by July. The trade is long, TP = 1,200.
## If you like our free content follow our profile to get more daily ideas. ##
## Comments and likes are greatly appreciated. ##
Netflix: New All-time High!As expected, Netflix reached a new all-time high at $1,067, completing the magenta wave . Since then, the stock has already pulled back by nearly 20%. The ongoing magenta wave should extend further into our new magenta Target Zone, which spans $789.04 to $704.43. Since we anticipate a sustainable rebound from this range, it presents an opportunity to initiate or expand long positions. Such long entries could be hedged with a stop 1% below the Zone’s lower boundary, as there is a 30% chance that Netflix will drop below the Zone to complete the green wave alt. .

NETFLIX: testing the 1D MA50. Buy?Netflix is marginally bearish on its 1D technical outlook (RSI = 43.757, MACD = 4.950, ADX = 42.375) as the December correction is testing now the 1D MA50. Technically this has been the trend's support since mid August 2024. The 2 year Channel Up offers useful conclusions here. Each of its past January months (2023 and 2024) saw a surge of +38% from their closest low. If this is repeated again, then the price will test the Channel's top. Aim for that +38% rise (TP = 1,200).
## If you like our free content follow our profile to get more daily ideas. ##
## Comments and likes are greatly appreciated. ##

Netflix (NFLX) Analysis: Multi-Timeframe PerspectiveA More Detailed analysis on Netflix (NFLX) from a Multi-Timeframe Perspective.
Check out my other analysis for a detailed explanation on this video

NETFLIX: This rebound isn't a buy opportunity.NFLX is staging a rebound on the 1D MA50 on a marginally bullish 1D technical outlook (RSI = 56.295, MACD = 4.710, ADX = 36.125). We don't consider this a buy opportunity as even if a slightly HH is made, the 1D RSI is showing a Bearish Divergence on a Channel Down, the same kind of bearish pattern that started the bearish waves in the two HH prior. Consequeantly we expect a pullback to at least the bottom of the Channel Up (dashed) or the HL trendline (which will be -25.25% from the top) depending on when the 1D RSI crosses under the 30.000 level (oversold), which was the buy trigger on the last two bottom opportunities. We have a long term TP = 550.00.
See how our prior idea has worked:
## If you like our free content follow our profile to get more daily ideas. ##
## Comments and likes are greatly appreciated. ##

NETFLIX: Buy opportunity on a 4 month stretch.NFLX is trying to find support on the 1D MA200, which is at the bottom of a (longer than a year) Bullish Megaphone pattern. The 1D technical outlook is red (RSI = 36.027, MACD = -9.900, ADX = 36.923) signifying considerable upside potential and the rebound on the 30.00 oversold RSI level indicates the reversing momentum. We expect an immediate rally as part of the new bullish leg that will target the 0.786 Fibonacci (TP = 585.00).
Prior idea:
## If you like our free content follow our profile to get more daily ideas. ##
## Comments and likes are greatly appreciated. ##

NETFLIX: Sell conditions emerge. Bearish rest of Summer.Netflix is trading inside a Megaphone pattern since the May 2022 bottom and is approaching the formation's top. The 1D time frame is on green technicals (RSI = 68.406, MACD = 15.870, ADX = 40.286) but just 2-3 weeks ago it was massively overbought, showing that the massive bullish leg is getting exhausted.
Be ready to sell and buy back on the 0.382 Fibonacci (TP = 370.00). That will make a technical Megaphone bottom on the HL trendline while approaching or touching the 1D MA200. This is where we will buy again and target the 0.786 Fibonacci (TP = 585.00).
## If you like our free content follow our profile to get more daily ideas. ##
## Comments and likes are greatly appreciated. ##
