Adyen (ADYEN) – Technical Analysis and 1W OutlookTechnical Analysis
Adyen's stock is forming a symmetrical triangle, indicating a potential breakout. The recent price surge confirmed the pattern's breakout, but a correction toward the 0.618 Fibonacci level (1457.2 EUR) is possible, acting as a key buying zone.
Key Levels:
Resistance: 1720.8 EUR (0.5 Fibonacci), 2311 EUR (0.236 Fibonacci)
Support: 1457.2 EUR (0.618 Fibonacci), 1081.8 EUR (0.786 Fibonacci)
Target: 2838 EUR
Indicators suggest a potential continuation of the uptrend:
MACD is signaling bullish momentum
Stochastic indicates a possible correction before further upside
Fundamental Analysis
Adyen is a leading player in the payment technology sector, serving major companies like Uber, Spotify, and Microsoft.
Key Factors Impacting the Stock:
Financial Performance: Recent earnings reports showed revenue growth driven by increased payment volumes.
Macroeconomics: Lower inflation and potential interest rate cuts could benefit the tech sector.
Competition: Pressure from PayPal and Stripe remains a key risk.
Adyen maintains bullish potential following the triangle breakout. The 1457-1500 EUR zone is crucial for trend confirmation, with a possible long-term target at 2838 EUR. However, a short-term correction remains possible.
Netherlands

NETH25/NL25 "Netherland 25" Indices Market Bearish Heist Plan🌟Hi! Hola! Ola! Bonjour! Hallo!🌟
Dear Money Makers & Robbers, 🤑 💰🐱👤🐱🏍
Based on 🔥Thief Trading style technical and fundamental analysis🔥, here is our master plan to heist the NETH25/NL25 "Netherland 25" Indices Market. Please adhere to the strategy I've outlined in the chart, which emphasizes short entry. Our aim is the high-risk Green Zone. Risky level, oversold market, consolidation, trend reversal, trap at the level where traders and bullish thieves are getting stronger. 🏆💸Book Profits Be wealthy and safe trade.💪🏆🎉
Entry 📈 : "The vault is wide open! Swipe the Bearish loot at any price - the heist is on!
however I advise placing Sell limit orders within a 15 or 30 minute timeframe. Entry from the most recent or closest low or high level should be in retest.
Stop Loss 🛑: Thief SL placed at (936.00) swing Trade Basis Using the 3H period, the recent / swing high or low level.
SL is based on your risk of the trade, lot size and how many multiple orders you have to take.
Target 🎯: 900.00 (or) Escape Before the Target
🧲Scalpers, take note 👀 : only scalp on the Short side. If you have a lot of money, you can go straight away; if not, you can join swing traders and carry out the robbery plan. Use trailing SL to safeguard your money 💰.
📰🗞️Fundamental, Macro, COT Report, Sentimental Outlook:
NETH25/NL25 "Netherland 25" Indices Market is currently experiencing a Neutral trend (Slightly Bearishness)., driven by several key factors.
🎇🎆Fundamental Analysis
Earnings: Q4 2024 strong for Dutch firms (ASML, Shell), reported Jan 2025; Q1 2025 prelims suggest tech/energy resilience—bullish.
Rates: ECB at 2.5% (ECB Data Portal)—low yields support equities—bullish.
Inflation: Eurozone 2.8% (Eurostat, Jan 2025)—above target, mixed impact.
Growth: Netherlands GDP ~1.5% (Eurostat Q4 est.)—steady, mildly bullish.
Geopolitics: U.S.-China tariffs shift trade to Europe (ECB projections)—bullish.
🎇🎆Macroeconomic Factors
U.S.: PMI 50.4, Fed 3-3.5%—USD softness aids Eurozone equities—bullish.
Eurozone: PMI 46.2 (Eurostat, Feb 2025)—stagnation, bearish; ECB easing helps—bullish.
Global: China 4.5%, Japan 1% (ECB forecasts)—slowdown, risk-off—bearish.
Commodities: Oil $70.44—stable, neutral
Trump Policies: Tariffs (25% Mexico/Canada, 10% China)—trade benefits Europe—bullish.
🎇🎆Commitments of Traders (COT) Data
Speculators: Net long ~25,000 contracts (down from 30,000)—cautious bullishness.
Hedgers: Net short ~30,000—stable, locking in gains.
Open Interest: ~60,000 contracts—steady global interest, neutral.
🎇🎆Market Sentiment Analysis
Retail: 50% short (global X posts)—balanced, mild upside risk—neutral.
Institutional: Bullish on tech (ASML), cautious on growth (ECB forecasts)—neutral.
Corporate: Dutch firms hedge at 935-940—neutral.
Social Media Trends: Mixed—bullish to 950, bearish to 910—neutral.
🎇🎆Positioning Analysis
Speculative: Longs target 940-950, shorts aim for 910-900 (global consensus).
Retail: Shorts at 930-935—squeeze risk if price rises.
Institutional: Balanced, tech-driven optimism.
🎇🎆Quantitative Analysis
SMAs: 50-day ~885, 200-day ~860—price above both, bullish.
RSI: 58 (daily)—bullish momentum, not overbought.
Bollinger: 910-930—price at upper band, breakout potential.
Fibonacci: 61.8% from 950-800 at 900—support below holds.
Volatility: 1-month IV 13%—±10-point daily range.
🎇🎆Intermarket Analysis
EUR/USD: Below 1.0500—EUR weakness, neutral for AEX.
DXY: 106.00, softening—supports equities—bullish.
XAU/USD: 2910—gold rise, risk-off—bearish.
DAX: ~19,000, stable—correlated support—neutral.
Bonds: Eurozone 2.2% (ECB)—low yields aid equities—bullish.
🎇🎆News and Events Analysis
Recent: Eurozone GDP flat (Eurostat Q4 2024)—bearish; tariffs shift trade (ECB)—bullish.
Upcoming: U.S. PCE (Feb 28)—hot data lifts USD/yields, pressures AEX; soft data rallies equities—mixed.
Impact: Bullish short-term, PCE reaction key.
🎇🎆Next Trend Move
Technical: Support 910-900, resistance 940-950. Below 910 targets 900; above 940 aims for 960.
Short-Term (1-2 Weeks): Up to 940-950 if risk-off eases; dip to 900 if PCE strengthens USD.
Medium-Term (1-3 Months): Range 900-970, tariff-driven.
🎇🎆Future Prediction
Bullish: 950-970 by Q2 2025 if USD softens (DXY to 105), tariffs boost exports, or risk-on strengthens.
Bearish: 900-890 if PCE lifts USD (DXY to 107), growth stalls, or risk-off intensifies.
Prediction: Bullish short-term to 950, then sustained to 970 by mid-2025.
🎇🎆Overall Summary Outlook
Netherlands 25 at 928.00 rides bullish fundamentals (tech earnings, ECB support, trade shifts) against bearish risks (Eurozone stagnation, PCE-driven USD strength). COT shows cautious longs, quant signals bullish momentum, and intermarket trends (DXY softness) support gains. Short-term rise to 940-950 likely, medium-term to 970 if PCE softens and trade benefits grow.
📌Keep in mind that these factors can change rapidly, and it's essential to stay up-to-date with market developments and adjust your analysis accordingly.
⚠️Trading Alert : News Releases and Position Management 📰 🗞️ 🚫🚏
As a reminder, news releases can have a significant impact on market prices and volatility. To minimize potential losses and protect your running positions,
we recommend the following:
Avoid taking new trades during news releases
Use trailing stop-loss orders to protect your running positions and lock in profits
💖Supporting our robbery plan 💥Hit the Boost Button💥 will enable us to effortlessly make and steal money 💰💵. Boost the strength of our robbery team. Every day in this market make money with ease by using the Thief Trading Style.🏆💪🤝❤️🎉🚀
I'll see you soon with another heist plan, so stay tuned 🤑🐱👤🤗🤩

Target 1192Following weekly chart.
I think chart says it's a perfect place to collect some Adyen shares.
Yesterday I bought from 381 and planning to hold them till 1192.
I'll hold if it still remains above 650 weekly close.

Weekly chart, time to long, target 2Following weekly chart.
Got a long signal from my indicator.
TP EMA100 or 2
SL 1.46 - I am using indicator stop loss but 1.46 might be a good candidate to stop.

I hope I'm wrong with Spar going to R52.78There is an Inv C&H that's formed on the monthly chart with Spar.
It's been coming down since April 2016 where it just couldn't break above R225.00.
Since then we've seen supply (selling) strong than buying.
And now with the price breaking below the Inv C&H, shows downside to come.
I hope I'm wrong with this one and they do something miraculous to pick up the price.
21>7
Price<200
Target R52.78
ABOUT THE COMPANY
~ The SPAR Group is a leading South African retail chain that operates in the grocery and convenience store sector.
~ SPAR Group South Africa is part of the international SPAR Group, which originated in the Netherlands in 1932 and has since grown into a global network of independent retailers. (There is even Spars in Greece - SPAR HEllas)
In South Africa, SPAR operates under various store formats, including SPAR, SUPERSPAR, TOPS at SPAR, and SPAR Express. Each format caters to different customer needs and market segments.
SPAR Group South Africa has a strong presence nationwide, with stores located in urban areas, townships, and rural regions.
HOW IT GOT ITS NAME
"SPAR" originated from the initials of the founding Dutch company's slogan, which was "Door Eendrachtig Samenwerken Profiteren Allen Regelmatig" (English translation: "Through united cooperation, everyone regularly benefits"). The first letters of each word spell out "SPAR."

Target 25.17Following weekly chart
There is a clear cup & handle formation.
I mostly follow handle target, so
TP 25.17
SL 9.16 - I know it's too far away but technically this is what it is.

NL25 RESISTANCE BREAKNL25 instrument, the 25 Blue Chip companies of the Netherlands index, broke its resistance at 738.438 which is a signal for a bullish trend. If this price movement continues, the price might try to test prices around 786 mark. In the opposite scenario, the price might revert to 668.53
Both MACD and RSI are also supporting the bullish trend, with MACD histogram being above 0 and RSI being above 50 neutral line.
Risk Disclosure: Trading Foreign Exchange (Forex) and Contracts of Difference (CFD's) carries a high level of risk. By registering and signing up, any client affirms their understanding of their own personal accountability for all transactions performed within their account and recognizes the risks associated with trading on such markets and on such sites. Furthermore, one understands that the company carries zero influence over transactions, markets, and trading signals, therefore, cannot be held liable nor guarantee any profits or losses.

NN Group N.V. (NN.as) bullish scenario:The technical figure Falling Wedge can be found in the daily chart in the Dutch company NN Group N.V. (NN.as). NN Group N.V. is the parent company of NN Investment Partners and Nationale-Nederlanden. Nationale-Nederlanden is one of the largest insurance and asset management companies in the Netherlands. The Falling Wedge broke through the resistance line on 05/10/2022. If the price holds above this level, you can have a possible bullish price movement with a forecast for the next 13 days towards 44.35 EUR. Your stop-loss order, according to experts, should be placed at 38.73 EUR if you decide to enter this position.
NN Group NV expects to accelerate its deadline to exit coal investments, now set at 2030, due to fears about Europe reverting to burning the fossil fuel, the Dutch insurer's CEO David Knibbe said on the sidelines of the World Economic Forum.
Risk Disclosure: Trading Foreign Exchange (Forex) and Contracts of Difference (CFD's) carries a high level of risk. By registering and signing up, any client affirms their understanding of their own personal accountability for all transactions performed within their account and recognizes the risks associated with trading on such markets and on such sites. Furthermore, one understands that the company carries zero influence over transactions, markets, and trading signals, therefore, cannot be held liable nor guarantee any profits or losses.

Wait with your new energy contractsGas prices are at an all-time high, in the warmest winter in the Netherlands i can remember, the impact on every day life is starting to become problematic for lots of people, especially the ones that need to renew their energy contracts now. Stay where you are with variable rates. This huge support is about to break on every time frame, if we are lucky we can renew our contracts in May with a price of 0.30ct and a duration of 3 years.

PHIA | Time to buyPhilips has reached it's (nearly) lowest levels for the last 3-5 years,
The reason seems to be a recall of equipment of a value of about 4bl$.
In general the company is quite healthy, no debts, positive cashflow, not very impressive, but still good PE and EPS ratios.
They have concrete development plans and solid background for upcoming profits.
The stock price may in the near future go below 30 euros, down to 27 euros as worst in my opinion.
Considering the fundamental background information and technical analysis expectations (which logically support each other), in a year or two, the stock price could reach the 55-60 euros, meaning doubling.
Considering the purchase price, background info and technically expected future price, now it seems to be a good time to enter the market.
The only drawback investing in PHIA, could be longer return periods, than initially expected.
Since the company is not generating high profits, and pays dividends, they might need much longer time to recover and grow further.
For the rest, it's a healthy company, strong brand and pretty cheap offer, for those who might like the company as investment item.

$ESTC: Netherlands Data ManagementStrong momentum setup here with ESTC, going to be watching potential break outs next week

AEX at crucial POINT!As shown in the graph, the AEX index is at a crucial point. If they break the small resistance line, we can expect uptrend movement to around 800-805 points. If the resistance line holds, we can expect more downtrend or sideways movement to potentially 778 points. Drop a comment in the comment section and a like if you agree with this prediction and/or have other opinions!

NETHERLANDS 25 ON ITS WAY DOWN?We have reached the top of the rising wedge which has acted as a reversal point numerous of times previously and I'm expecting a similar instance once again.
Daily, weekly and Monthly RSI are all overbought and are calling for a breather.
My minimal targer is 720 which is roughly a 6% reversal.

NLG/USD Awakens from Bearish Hibernation; Last stop: ValhallaThis project is one of the best kept secrets in the entire crypto space. While people chase after DOGE which has over 120B coins and very little development and only rises because of the Musk Effect, Gulden's current supply is ~0.475% of DOGE's...which makes the NLG supply *closer to BTC's supply than DOGE's supply is to Gulden's* ...yet DOGE is 4x the price of Gulden?! Think about that for a while.
In terms of "Value Investing", one might say that NLG's eventual and much-deserved appreciation will make DOGE's rise look modest by comparison, especially when you take into account NLG vs. DOGE current price per exchange volume in relation to aggregated available supply. There are folks selling dozens of millions of DOGE at 5 cent, meanwhile there are less than 5 Million NLG *that are even available to be bought from the order books*--That's how scarce NLG is since a significant percentage of the supply is locked into the Witnessing protocol that rewards holders which makes NLG objectively one of the safest, longest standing and efficient blockchains available. It just needs more promotional traction from popular influencers and a handful of fat cats to start entering the fray... and the price discovery that could occur for Gulden would (once again) bring the spotlight onto the vibrant fintech environment in which it can begin to flourish as a store of value and resume its status as one of the top merchant-centric and user-friendly cryptos available.
Green lines signify structural avenues within the incoming bull market.
Short term: look for consolidation in the 0.012-0.015 range to solidify and a break toward the recent local high of just over 2 cents.
Medium term: If it violates the 0.0225-0.025 zone and breaks noticeably back above this nearly 3 year price resistance at this level, look for another doubling effect up to 4-5ish cent range and around here another raucous consolidation hangout between the former resistance of 0.025 and 5 cent is likely. If we start flooding past 5 cents, then another doubling effect will likely occur.
Long term: 10-15 cents then becomes the next logical trading range for NLG to re-establish (since it traded in this zone for over a year between late 2016-early 2018 in the prior bull market in its early development phases, now it's way more seasoned).
Longer term: NLG Will eventually challenge prior ATH again (30x from here) and could even breeze past it the more capital inflows amplify and stay within the crypto sector, which appears likelier by the week at this point.

*BULLISH* 6.5% breakout to $61.90 target by New Years *full disclosure* I have a 28,000 CHF long position in RET*
Retail Estates is an underappreciated European retail REIT that is primed for a substantial technical breakout this December. Please take the time to look over the technical analysis, which is purposefully decluttered to provide a utilitarian analysis of the overall forecasted direction of the share price.
The fundamental analysis is far more appetizing since the REIT is likely to be a pillar in my portfolio, similar to how SGRO was over the last 5 years. Similar to SGRO that focused on commercial real estate on the periphery of town, RET does the same for retail outlets, except instead of encompassing the UK and pan-Europe, they specialize in Belgium and the Netherlands.
As COVID-19 vaccines are set to roll out across Europe, the smaller countries are likely to be more efficient in distribution than the larger ones. Furthermore, Belgium is home to the ECB and the Netherlands is home to the International Justice Court, and with Brexit underway, these are two highly English proficient, international countries that are likely to benefit from a "no deal".
Work culture is ultimately shifting to stay-at-home, but the office in the center of town will remain a cornerstone of any business. RET's retail outlets are perfectly suited to take advantage of this new trend as more people live on the periphery of towns and make trips into town on a ad hoc basis. All in all, given the technical and fundamental analysis, I am bullish on the stock.
Thank you for reading and considering my analysis.
Yours Sincerely,
Turner Capital Management

Netherlands StocksAmro Bank - Euro-next Amsterdam , has a good opportunity if it cross above 8.45.
Let's see! :)


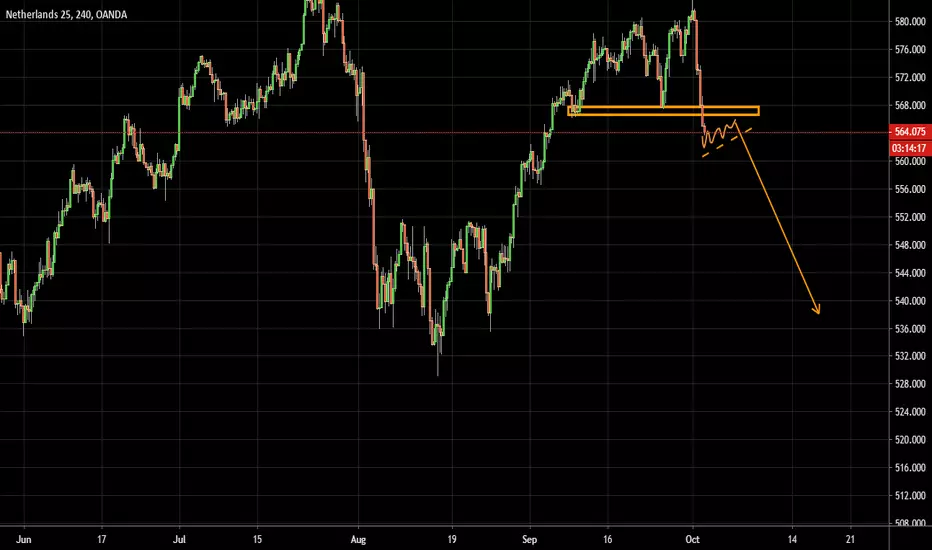
NL25 EUR SELL (NETHERLANDS 25 INDEX - EURO)Hi there. Price is forming a continuation pattern to the downside. Watch strong price action at the current price for sell.

AEX Is Inside a Rising Wedge, After Struggling at the 0.500 Fib Let's look at the Dutch AEX index. The prices seem to not have recovered as much as the american stock markets, giving us more opportunity to trade with higher percentage gains. However, I am starting this one with my analysis on an upcoming short trade.
I'm not a huge fan of this inverted fibonacci retracement, but saw it getting very popular on charts recently to model the big Corona drop. If we use this charting method, we do see the price struggled quite a bit to overcome the 0.5 fib level.
After oscillating quite a bit in this rising wedge, we are reaching the point where the price will need to make a decision soon.
A rising wedge is a bearish pattern, so I expect a bearish breakout after reaching still slightly higher. possibly around the 525 level.
Follow me for consistent high quality updates, with clear explanations and charts.
Please like this post to support me.
- Trading Guru
--------------------------------------------------------------
Disclaimer!
This post does not provide financial advice. It is for educational purposes only!

Some companies will do really well [Oil Storage]They are almost at full capacity.
The Oil minus 40 price might be from all the retail traders rushing into an Oil ETF that balooned and struggled to rollover their contracts to June.
Or it might entirely be due to every one being at full capacity.
It is not over, US Oil producers are still extracting Oil, because no one wants to be the one to reduce his output and sacrifice so others can sell at a better price.
Either way the storage issues are still here and June will be much worse than May with storage.
Oil volatility got to out of this world levels.
Of the 10 worse days for Oil prices I think 3 or 4 are in 2020, but no problem eyy, every thing will be fine, we'll just print imaginary money to solve very real problems!
There won't be a depression nah last time "they" said this and everything recovered quickly just hodl. Those are just alarmists.
Aaaand brent is crashing too now...
The NL indice is red,
Really out of my field of expertise here, but I wonder if this company can jump to new highs in 2020.
They have to have a bright future ahead.
It will be interesting to keep an eye on this.

Daily Covid-19 growth NLFirst sign of declining growth in confirmed cases (not a decrease in cases, slowly diverging from exponential growth curve ... probably effects of government measures).

NL25 EUR SELL (NETHERLANDS 25 INDEX - EURO)Hi there. Price is forming a continuation pattern to the downside. Wait for the price to complete the pattern and watch strong price action for sell.

sell nl25eurI already have a sell on this one but I am looking forward to adding another position using a sell stop if i see a flag as I indicated above