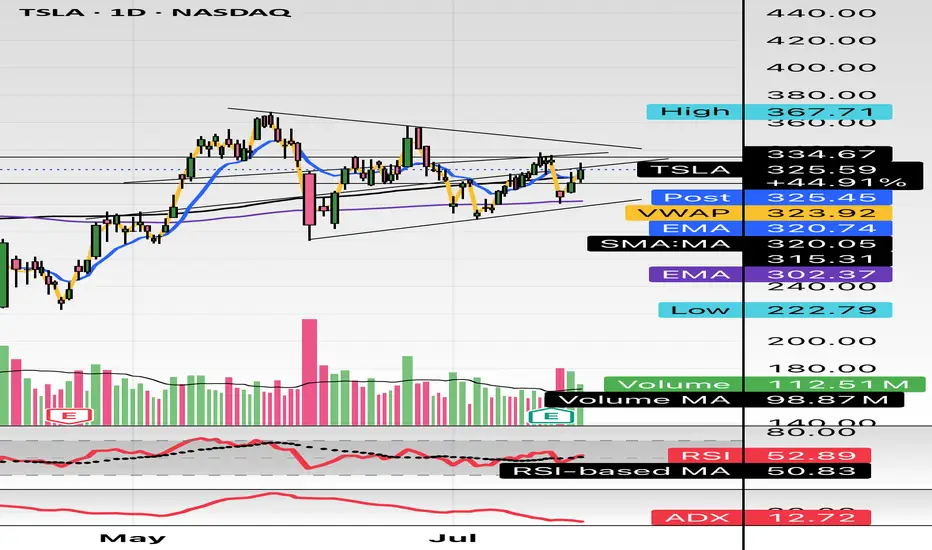
$TSLA either one big flag or massive short setting upHello,
Just some browsing, NASDAQ:TSLA hasn’t had any major moves prior to early May - June IMO. This is on my watch for a short swing setup. This is bull flagging but I see a short here. I’m conflicted. I do see the higher low but we are in a pitchfork and this has been consolidating in this $290-$340 area for about a month and half. There’s also a lower high. Just posting for some free dialogue and open ideas. Talk to me. Let me know what you see and think. We aren’t too far from 200EMA and 200SMA. It’s just curling above the 50 as well. Maybe we consolidate for another week or two? A massive move is brewing here I think. I’m talking $100 in a week up or down soon.
WSL
Neutral
GD : Worth WatchingI am one of those who think that General Dynamics stock should be watched carefully for a while.
The trend line was drawn by taking into account past tariff discussions and the price movements that resulted from them.
What we need:
Volume data with a clear increase
Persistence above the 50 and 200-period moving averages
Persistence above the FIBO 0.5 retracement level (278.23) for a while
I am currently neutral but keeping an eye on long positions.
Regards.

US30 JUNE 2What did the Buffalo say to his son when he left home? Bison...
Anyway, let's get to work. Price is looking very messy. So instead of trading it I'm going to draw a box around the consolidation and wait for price to break and retest the ends of the boxes.
Like always I'll wait for the 1m for price to break and retest before I enter the trade.
NEVER Trade Consolidation, it gets messy quickly.
Anywho... Have fun trading and be patient.

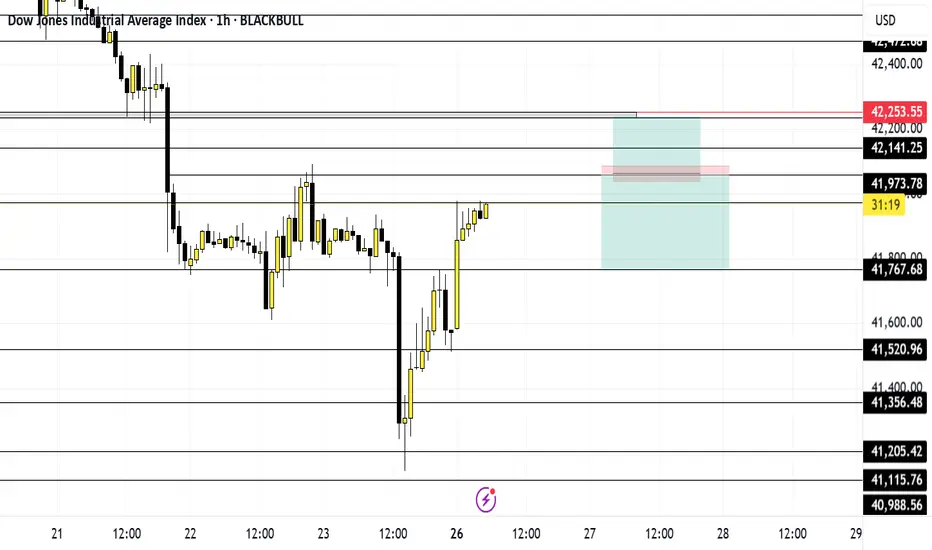
May 26 US30Let's get to work... Price at the moment is trending down, creating lower highs and lower lows on the 4hr. However it broke structure on the 1hr and is trending upward.
I'm going to wait for price to get to 42,055 level and wait for it to break and retest for a buy or break structure for a sell.
Caution. Monday is a holiday so I most likely won't trade until Tuesday.
And ultimately whichever way price goes I'm going to get out at my net key level.
Have fun, stay safe and enjoy your journey
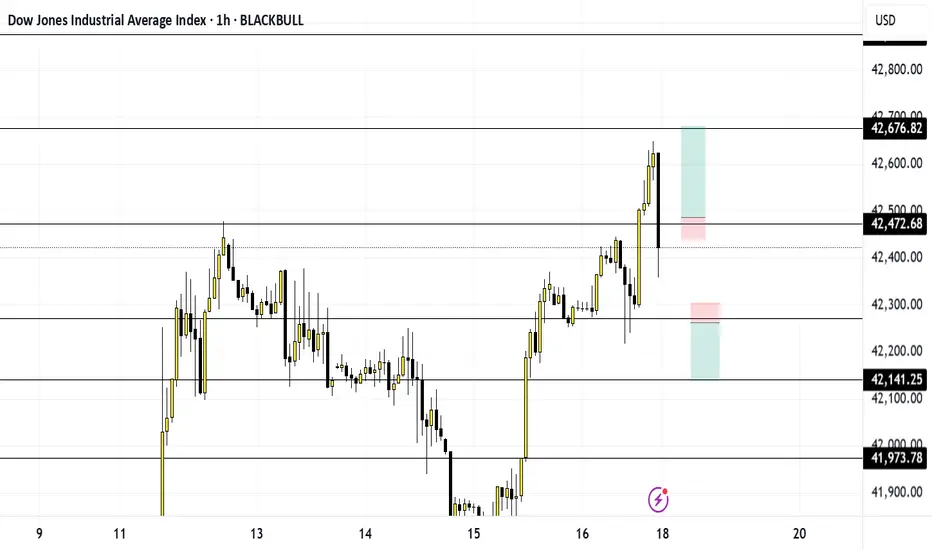
US30 Markup May 18thWhat did the tomato say to the other tomato during a race? Ketchup!! Now lets ketchup on these charts.
Price is in an uptrend and is nearing my key level 42,474. If price breaks and retests that area, then I will get in for the buy and buy up to 42,672 area.
However, like a puppy, price does whatever it wants. So, if price breaks structure around 42,268, I shall wait for price to break and retest that area so I can get in for the sell down to 42,141.
I shall be waiting for the break and retest on the one-minute timeframe for both the buy or sell.
Lastly, enjoy yourself, and be responsible.
EGX30 Neutral Zone AnalysisEGX30 stock is currently in a neutral zone, between the 31,970 resistance line and 31,424.07 support line, reflecting the buyers' and sellers' wait and taking their time for market analysis, especially with the investment atmosphere that is full of unaligned points of view. In case of taking an upward trend, it is expected not to breach the resistance line at 32,464.493 points, but in case of falling, it's expected not to break the support line at 29,989.245.

USDCHF RANGEPrice is overall bearish. Price has been in a range for a few weeks so one could either look for trades near support/resistance or wait for price to break support/resistance.

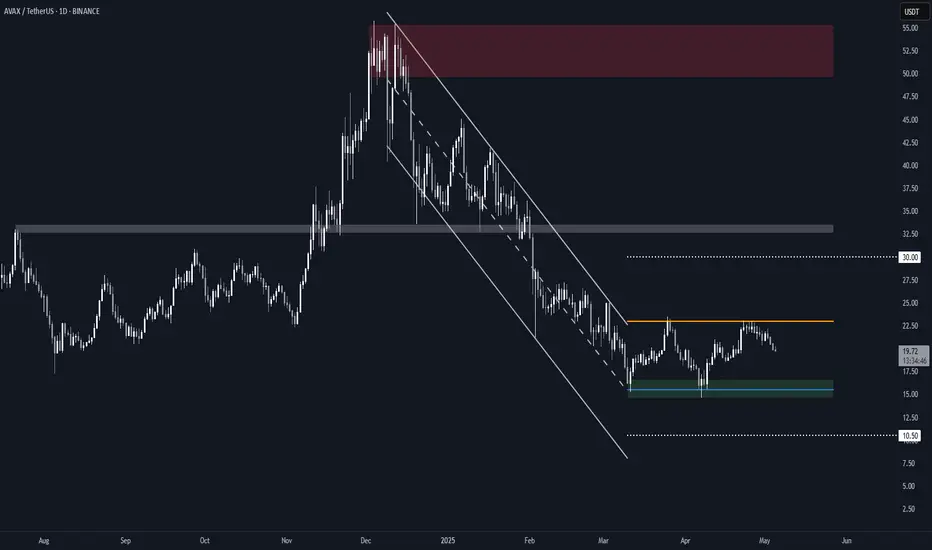
Avalanche (AVAX) RectangleBINANCE:AVAXUSDT is trading within a well-defined rectangle, after breaking out of a steep falling channel earlier this year.
Key Observations
• The current range has two clear touches on both support ($15.50) and resistance ($23.00), forming a valid rectangle structure.
• This follows a sideways channel breakout, suggesting a consolidation phase which is often a precursor to a larger move.
Range Levels
• Resistance – $23.00: Capped price twice in April, marking the upper bound of the rectangle.
• Support – $15.50: Held firmly on two separate pullbacks.
• Midrange Bias – As long as AVAX remains within this box, directional conviction remains limited.
Breakout/Breakdown Scenarios
• Bullish Breakout: If AVAX closes decisively above $23.00, the measured target would be ~$30, based on the rectangle height projected upward (linear scale).
• Bearish Breakdown: If it loses $15.50 support, the downside target becomes $10.50, calculated using the same rectangle height on log scale (to reflect proportional downside risk).
Until either side breaks, this remains a range-trading environment.
$SHOP head and shoulders formation 1M?Hmmm, there was a similar looking setup on NASDAQ:NFLX within the last week of a similar slope up with a head and shoulders like this and it tanked. This will be on watch months to come. Could go long for a month to two and then get ready to short.
WSL

BTC ANALYSIS 🔮 #BTC Analysis 🚀🚀
💲💲 #BTC is trading between support and resistance area. There is a potential rejection again from its resistance zone and pullback from its major support area. If #BTC breaks resistance zone $88500 then there will a chance of bullish movement
💸Current Price -- $84470
⁉️ What to do?
- We have marked crucial levels in the chart . We can trade according to the chart and make some profits. 🚀💸
#BTC #Cryptocurrency #DYOR

SOLUSD Analysis1. Current Price Context
Price Movement: SOL has gained 7.44% recently, showing strong upside potential.
Trend Structure: The price is attempting to break above key resistance zones after bouncing from recent lows.
2. Key Support & Resistance Levels
Support Levels (Downside Risk)
$131.80–$133.80 Zone – Current short-term support. If price holds above this range, bullish continuation is likely.
$124.87 – Major support level. If SOL falls below this, the bullish momentum could fade.
Resistance Levels (Upside Targets)
$135.99 – Immediate resistance level SOL is currently testing.
$137.00–$138.00 – Next resistance; breaking this could accelerate a move higher.
$150.50 – Primary target and the key resistance in the next leg up.
3. Technical Indicators & Trend Analysis
EMA Ribbon (Dynamic Support/Resistance)
The EMA ribbon is acting as resistance, and SOL is currently battling to break above it.
A decisive close above the ribbon would be a strong bullish signal.
Trendline Analysis
The downward trendline from previous highs intersects near $150.50, meaning this level is crucial for breakout confirmation.
If price reaches $150 and consolidates, it could set up a trend reversal to the upside.
Volume & Momentum Indicators
RSI (Relative Strength Index): 39.38 – showing weak bullish momentum, but not overbought.
MACD (Moving Average Convergence Divergence): -11.97 – still negative, but improving, indicating potential upside acceleration.
Volume Analysis: Needs a significant increase for confirmation; if price rises with low volume, a rejection at resistance is likely.

$AMAT with a neutral outlook following its earnings #StocksThe PEAD projected a neutral outlook for NASDAQ:AMAT after a negative under reaction following its earnings release placing the stock in drift D with an expected accuracy of 87.5%.

$XOM with a neutral outlook following its earnings #StocksThe PEAD projected a neutral outlook for NYSE:XOM after a positive over reaction following its earnings release placing the stock in drift B with an expected accuracy of 37.5%.

$MSFT with a neutral outlook following its earnings #StocksThe PEAD projected a neutral outlook for NASDAQ:MSFT after a negative under reaction following its earnings release placing the stock in drift D with an expected accuracy of 57.14%%.

GBPUSD (2H) - Short-Term ConsolidationFX:GBPUSD
📶 Technical Analysis:
Weekly Chart:
🟡 The price has been in a bearish trend since September 2024, with current levels near a strong support zone around 1.2100.
Daily Chart:
🟢 The bearish trend is confirmed by moving averages (MAs) and the formation of lower lows and lower highs. After testing the weekly support at 1.2100, a correction has occurred.
🟢 The price has double-tested a strong resistance level around 1.2500.
4-Hour Chart:
🟡 After strong bearish momentum at the start of 2025, the market has shifted into a bullish trend, but it is now in a neutral consolidation range between 1.2500 resistance and 1.2380 support.
🟡 There was a fake break of support caused by Trump's tariff policy.
2-Hour Chart:
🟠 A clear neutral formation has emerged, with high volatility since the beginning of February.
🔤 Summary:
🔴 Break above 1.2500: Could signal the start of bullish momentum.
🟢 Break below 1.2380: Could signal a shift to bearish momentum.
🟡 Until then, the price is likely to remain in a neutral zone.
🟡 Fundamental analysis is mandatory to understand the driving factors behind this pair. Watch the market expectations and economic indicators closely.
🟡 I am watching for clear technical formations and signals in the near future, mainly oriented for a short position if a clear opportunity arises.

BNB ANALYSIS🔮 #BNB Analysis 💰💰
As we see that there is a breakdown of the trendline in daily chart. We could see more correction or again a bearish momentum from its trendline after that a we could expect a bullish movement
🔖 Current Price: $616
⁉️ What to do?
- We have marked some crucial levels in the chart. We can trade according to the chart and make some profits in #BNB. Keep your eyes on the chart, observe trading volume and stay accustom to market moves.🚀💸
#BNB #Cryptocurrency #Correction #DYOR

DOT/USDT Weekly Analysis🔹 Key Resistance & Spot Trigger:
The chart indicates a major resistance level around $10.465, where the price previously faced rejection. This zone acted as a spot trigger, leading to a sharp decline in price.
🔹 Price Action & Trend:
After the rejection at the resistance, the price dropped significantly, aligning with the downward movement of the orange moving average. Currently, the market is testing a key support zone between $3.90 - $4.50.
🔹 Volume Analysis & Sales Pressure:
The increase in sales volume suggests that sellers are still in control. However, if the price finds strong support in the highlighted box, we may see a potential reversal or accumulation phase.
🔹 Future Outlook:
📉 If the support fails, further downside towards lower historical levels is possible.
📈 If buyers step in, a recovery towards the $6 - $7 resistance zone could be expected.
💡 Trading Plan: Watch for bullish signals within the support area before entering a position. Confirmation via volume and candlestick patterns will be crucial.

ACT ANALYSIS📊 #ACT Analysis
✅There is a formation of Descending Channel Pattern in daily chart. Currently #ACT is in bearish way.
After a breakout of the pattern and major resistance level we would see a bullish momentum otherwise the price will drop more 🧐
👀Current Price: $0.1968
⚡️What to do ?
👀Keep an eye on #ACT price action and volume. We can trade according to the chart and make some profits⚡️⚡️
#ACT #Cryptocurrency #Breakout #TechnicalAnalysis #DYOR

BAL ANALYSIS📊 #BAL Analysis
✅There is a formation of Descending Channel Pattern in weekly chart. Currently #BAL is in bearish way.
After a breakout of the pattern and major resistance level we would see a bullish momentum otherwise the price will drop more 🧐
👀Current Price: $2.750
⚡️What to do ?
👀Keep an eye on #BAL price action and volume. We can trade according to the chart and make some profits⚡️⚡️
#BAL #Cryptocurrency #Breakout #TechnicalAnalysis #DYOR

Why is BTC down today?Stocks and crypto both down the last couple of days. BTC often levers the remainder of the cryptosphere up and down based on it's own direction. Very much like a teacher and a group of students. Most will do what they're told, but there will also sometimes be a couple of rogues that don't follow the pack. With regards to BTC, we could be looking at a head and shoulders top. We've seen a piercing of the neckline today, only to rebound back above it. I'd say that if we see a decisive open and close below the neckline on a 4HR timeframe (minimum) H&S will be confirmed and we'll be down to the long purple box where there lies good resistance. Fear not! This is normal, natural and if you're an investor don't go chopping and changing. Just enjoy your weel and look out for the next few posts where we could leverage a great buy back with some extra cash. So, if you're going to do anything - raise some capital to add in! Follow and share for more.

DAX // neutral zoneThe market has turned south, after reaching the weekly target fibo 200, with a daily wave, and then tested the last clean daily breakout, but couldn't close above it.
It's between a daily breakout and a daily breakdown, that makes it a neutral zone. Leaving this zone (up north there is a clean H4 breakdown that may stop the bulls) puts the market either in the primary long expansion phase, or the countertrend expansion.
The target of the former is the weekly target fibo 213.2, the short target is the monthly breakout.
———
Orange lines represent impulse bases on major timeframes, signaling the direction and validity of the prevailing trend by acting as key levels where significant momentum originated.
Level colors:
Daily - blue
Weekly - purple
Monthly - magenta
H4 - aqua
Long trigger - green
Short trigger - red
———
Stay grounded, stay present. 🏄🏼♂️
<<please boost 🚀 if you enjoy💚

GOLD // neutral zoneThe market is close to the weekly breakdown, the daily impulse base and the H4 impulse base.
This fact alone, may trick the trader.
Above the H4 impulse base, the minor long trend may continue, and the primary long trend expansion phase begins above the last clear daily breakdown.
Below the daily impulse base, the market may go back to the daily countertrend.
———
We may not know what will happen, but we can prepare ourselves to respond effectively to whatever unfolds.
Stay grounded, stay present. 🏄🏼♂️
Your comments and support are appreciated! 👊🏼

GOLD // Trap for the Bulls&BearsThe market is mixed on the weekly, long on the daily, be below the last (or highest) clean daily breakdown.
The H4 is not in sync with the daily, and the market is between a breakout and a breakdown.
THIS MAKES IT A TRAP FOR BOTH BUYERS AND SELLERS.
I'll stay away from it.
———
We may not know what will happen, but we can prepare ourselves to respond effectively to whatever unfolds.
Stay grounded, stay present. 🏄🏼♂️
Your comments and support are appreciated! 👊🏼
