Up or down? What do you guys think. I don't knowMarket messes up both longs and shorts, it is better to stay out for about a half a year. I am heavily invested though. Hope it goes up but does not look very promising.
Neutral

$SHW with a Neutral outlook following its earnings #Stocks The PEAD projected a Neutral outlook for $SHW after a Negative Under reaction following its earnings release placing the stock in drift D with an expected accuracy of 25%.

Symmetry USDJPY. Head And ShouldersAmazing symmetry of the Head and Shoulders pattern played out in USDJPY. Of course we were prepared to see what we are seeing.
Going forward I can not remain bearish on the USD since in 2008 the USD was the flight to safety currency and the JPY collapsed.
Nevertheless it is a joy to be right. LOL!

$T with a Neutral outlook following its earnings #Stocks The PEAD projected a Neutral outlook for $T after a Positive over reaction following its earnings release placing the stock in drift B with an expected accuracy of 62.5%

#Doge $dogeDear Friend
there is a range area here in the multi-timeframe.
we have a flag pattern. if the price will broke up the descending channel, then it can go to the target. (resistance)
there are two Dynamic supports in analysis.
pay attention to them.

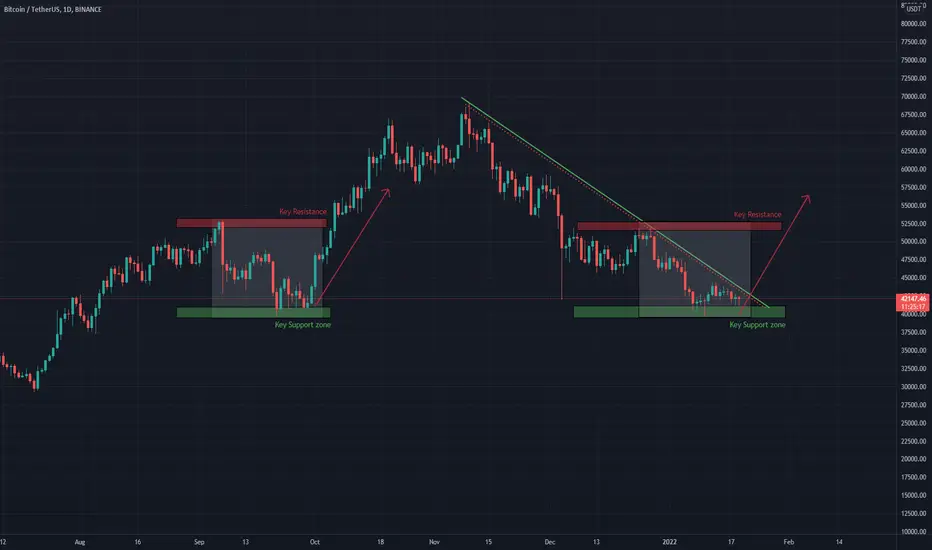
BTC Three scenarious I am watching at!Hey, you dont have to do a trade now and fomo in you can also just take some time and watch out at what is going to happen don't be scared to miss out something. There are a lot of oppurtunities you can take advantage of. What I had to learn was not fomo in something just because it went up. A lot of people that were bearish saying BTC will go down to 20k are now super bullish just stay neutral without emotions. Observe the market because everything can happen, if you think like that you will see what is really there and not what you want to see. I am still learning to get better at it.
Let me know what your scenarious are.

EURUSD POTENTIAL DONWFALLON approval of DOUBLE TOP on 1-DAY (1D) time frame we expect the value to go DOWN.
Bear in mind this is not a financial advice to take in, rather an expert option to rely on. Put accurate stop loss and tp ur gain it.
Ifu find it helpful please give review. Thanks, happy trading guys.

What I see. small correction incoming? then up?what do you think guys. rising wedge, small bearish div.

BTC Update - what's going on? Confluence appears...The latest "bull" move seems to have topped out at a nice confluence. Hindsight is 2020.... too. 2022...
Confluence:
- 1.618 extension off the low.
- 382 retracement of the bear move from 69k to 32k
- 12 Week EMA
- What about the 200 day MA?
I'm starting to feel bull, but we'll need to see this retrace with a proper bounce. Lots of indicators suggest an uptrend regardless if it is bull or a dead cat bounce. If we're lucky we'll retrace the bear move to 786 and get some nice bear entries after enjoying a nice bull rally. My count remains topped out at 69k, while some suggest 100k.
I'm willing to compromise at 75k based on some previous analysis but not 100k... let's see! :)

Don't mind me.Just toying around with the idea that people will soon be sinking returns and whatnot into bozo projects that seem ripe for a pump.
Not financial advice. Just posting so I have something to come back to with a more well developed idea for comparison.

$ASML with a Neutral outlook following its earnings #Stocks The PEAD projected a Neutral outlook for $ASML after a Positive over reaction following its earnings release placing the stock in drift B with an expected accuracy of 85.71%.
If you would like to see the Drift for another stock please message us. Also click on the Like Button if this was useful and follow us or join us.

$BAC with a Neutral outlook following its earnings #Stocks The PEAD projected a Neutral outlook for $BAC after a Negative Under reaction following its earnings release placing the stock in drift D with an expected accuracy of 50%.
If you would like to see the Drift for another stock please message us. Also click on the Like Button if this was useful and follow us or join us.

OIL in 1hr Ascending ChannelOi finds itself in another parallel channel. This time it is ascending and often
bearish. With lighter volume, oil continues to suggest that the
target of 93.23 will not be reached. Going forward Oil MUST reclaim the middle of
the ascending channel to stand a chance at a move higher. If it turns back at that price
level and specially breaking the bottom of the ascending (blue) channel this rally
is likely over for good.

Gold 4-Hour Channel Breakout Hits TargetOur 4-Hour channel Breakout from a few days ago has reached its target.
The target was the bottom of the beginning of the channel.
However, we had no retrace to the neck zone, so we had no entry.
I am a breakout and retrace trader, and if I see no retrace to the point of interest, I will not take a position.
My thoughts on Gold now is that if support does hold around the 1782 mark, we should begin ranging in short to mid-term between support and 1810.
Let’s watch and see what it does. I will be watching as always, and should a setup present itself; I will be posting it. Happy Monday!

OmiseGO , OMGUSDT 1DAll supports and resistances are marked on the chart. As we can see, the price is in an important range and recommended to keep an eye on it ...
Follow our other analysis & Feel free to ask any questions you have, we are here to help .
📊 #OMGUSDT ( OmiseGO )
💹 Time Frame : Daily
🔵 Personal Opinion : HODL
👤 Saeid.Mahbob
📅 01.27.2022
❤️ If you apperciate my work , Please like and comment , It Keeps me motivated to do better ❤️

US Oil 4Hr Analysis, Week 4 2022, Cad interest Rate DayWe are quite Bullish
The daily candle yesterday closed in a fashion
that validated longs to 90$ a barrel.
We are currently testing 4hr Resistance
It is most wise to wait for the Daily candle to close
or until asian session latter for any sells. For
buys, Fomc could be a catalyst for us to move out of
87$ and 88$ and continue on towards 90$ a barrel

Corrective Price Action In GoldGold similar to oil conitnues to drag its feet and move in an ascending (bearish) pattern by
making higher highs and then correct strongly downward. This zigzagging price action OFTEN
indicates WEAKNESS. Gold is ALWAYS mistaken to be a safe haven when times are tough for the
general markets. Well this is NOT the case and has not been for most of its modern history.
I believe this misrepresentation of gold comes from the price action of the 1929 crash where gold
I believe did move contrary to stocks at times. BUT it does not concern us what happend 90 years ago!
Gold prices I believe were fixed back then and so its outcome had to have been different. What does
concern us is what happened in 2008 where gold fell just like any other asset. And this continues to
inspire confidence that this will NOT BE THE DEFENSIVE ASSET EVERYONE ELSE THINKS GOLD IS!
It is an asset just like oil or stocks. And in hard times it too will fall. The price action here reminds
us that this will likely be the case and sooner than later. For now we remain neutral and wait for further
confirmation before well sell gold.

GBPJPY Multi-Timeframe Ananlysis, week 4 202270 Pip range on the 1hr/4hr
i believe the forex market is setting up for fomc
tomorrow, we shall wait and allow price to interact with the
weekly level at 153.400

USDCAD 4Hr Analysis, Week 4 2022Looking for a pullback to 1.257 for buys
This pair is playing out bearish as anticipated. It is possible that
we can just continue up to the Next 4hr Zone at 1.27300. However, after looking at the daily top wick rejection which is
larger than the body of the daily candle itself.. I question. It is possible we may consildate here at resistance for a day and break up
later in the week. We will see

BITCOIN , BTCUSDT 1DBitcoin
Unfortunately, Bitcoin lost significant support at $ 40,000 and reached $ 34,000 in one day after a fake move to increase its long positions and liquidate a lot of capital and a large dump at $ 43,000.
Numerous reasons, such as the negative fate of Russia and the intersection of death, also contributed greatly to this dump
Unfortunately, the bitcoin shoulder pattern was also approved, and if the price goes up according to this pattern, we will see a price of $ 20,000!
But the flat ABC pattern can not be ignored either, which is not too far off the mark and may happen and push the price upwards from $ 30,000

BTCUSDT , BITCOIN 1DBITCOIN
One of the optimistic scenarios that is not too far from expectation can be considered this scenario
Based on the history and past of Bitcoin in the past few months, this scenario was supposed to be in almost the same place and pattern!
Let's hope so :)
📊 #BTCUSDT ( BITCOIN )
💹 Time Frame : Daily
🔵 Personal Opinion : HODL
👤 Saeid.Mahbob
📅 01 .19.2022
❤️ If you apperciate my work , Please like and comment , It Keeps me motivated to do better ❤️
MORGAN STANLEY - BREAKOUT OR GOOD BUY OPPORTUNITYMorgan Stanley is expected to report earnings on 01/19/2022 before the market open. The report will be for the fiscal Quarter ending Dec 2021.
Better than expected results may give strong support to the bulls and send the price back into the channel. On the other hand, if the results do not satisfy the investors this will be a good signal for the bears to step in.
Morgan Stanley is the third-largest investment bank behind Goldman Sachs and JPMorgan Chase. In terms of revenue, it is the largest wealth management firm in the U.S. Morgan Stanley ranks behind only Goldman Sachs in the equity capital markets.
Risk Disclosure: Trading Foreign Exchange (Forex) and Contracts of Difference (CFD's) carries a high level of risk. By registering and signing up, any client affirms their understanding of their own personal accountability for all transactions performed within their account and recognizes the risks associated with trading on such markets and on such sites. Furthermore, one understands that the company carries zero influence over transactions, markets, and trading signals, therefore, cannot be held liable nor guarantee any profits or losses.

ALICEUSDT , My Neighbor Alice 1DAll supports and resistances are marked on the chart. As we can see, the price is in an important range and recommended to keep an eye on it ...
Follow our other analysis & Feel free to ask any questions you have, we are here to help .
📊 #ALICEUSDT ( My Neighbor Alice )
💹 Time Frame : Daily
🔵 Personal Opinion : HODL
👤 Saeid.Mahbob
📅 01.19.2022
❤️ If you apperciate my work , Please like and comment , It Keeps me motivated to do better ❤️
