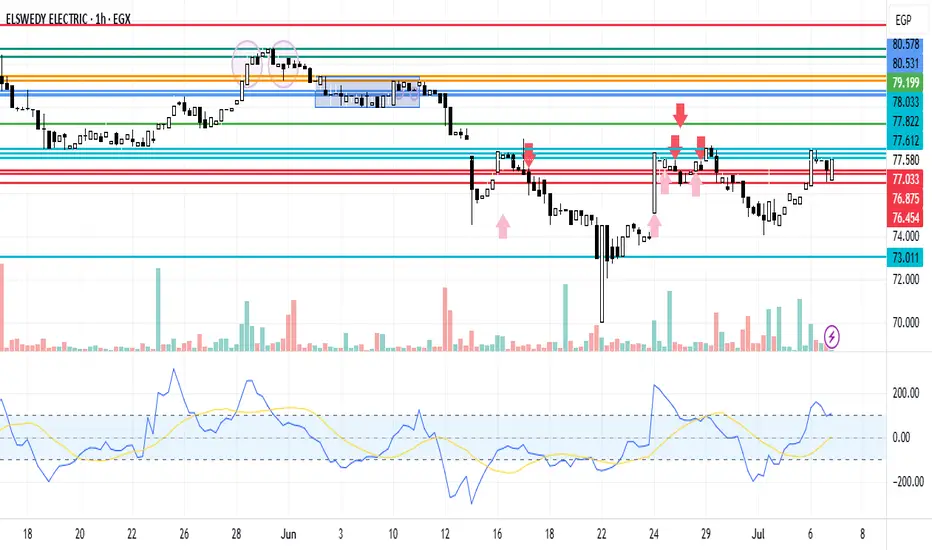
SWDY Neutral ZoneSWDY stock is in a neutral zone. In case of increasing, it's expected to breach the resistance line 77.612, 77.822 to reach 78.033. In case of decreasing, it's expected to break the support line 77.033, 76.875 to reach 76.454
Neutralposition
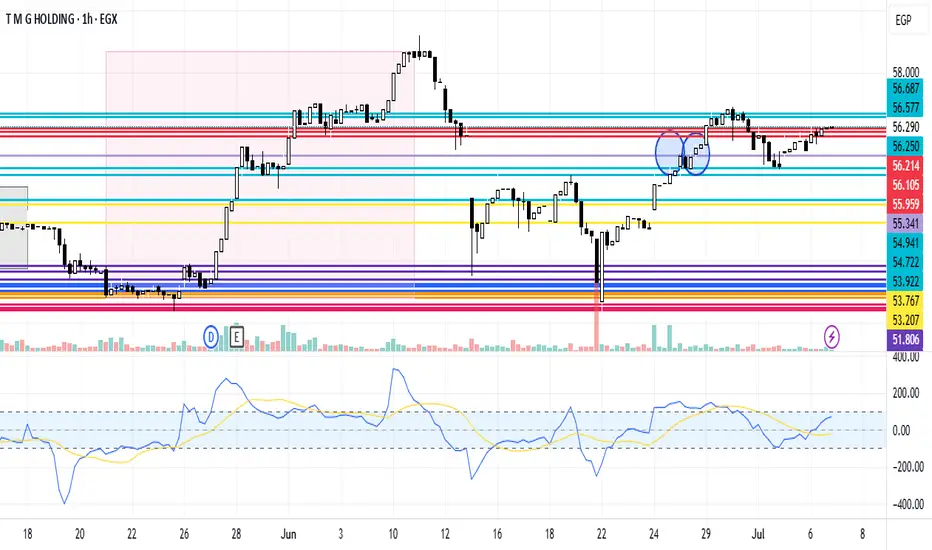
TMGH Neutral ZoneTMG Holding trend is in a neutral wave. In case of increasing it's expected to breach the resistance line 56.250, 56.577 to reach 56.687. In case of decreasing, it's expected to break the support line 56.214, 56.105 to reach 55.959
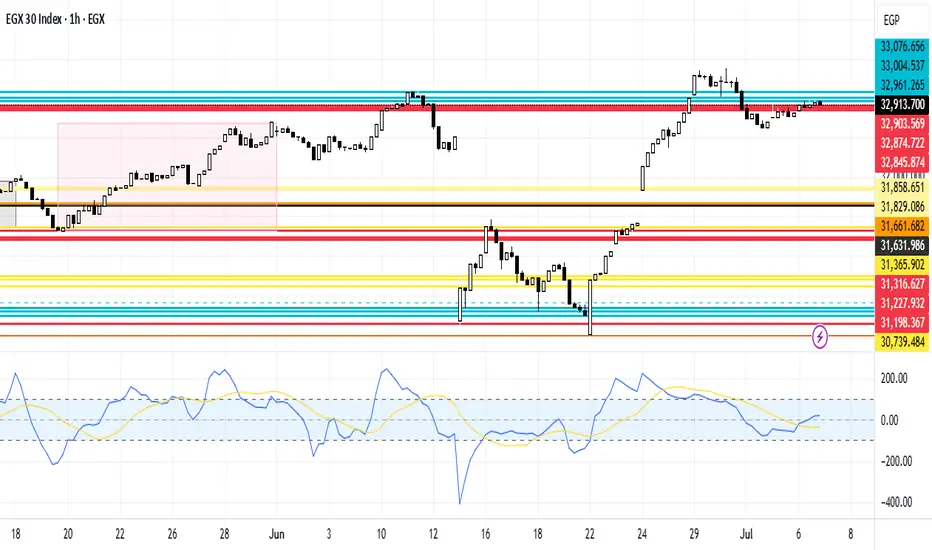
EGX30 Neutrality ZoneEGX30 stock is currently in a neutral region. In case of deceasing, it's expected to break the support line 32,903.569, 32,74.722 and 32,845.874. In case of increasing, it's expected to breach the resistance line 32,961.265, 33,004.537 then 33,076.656
DLTR: Range + Flow SetupDLTR – Trading Within Range Amid Strategic Evolution & Flow Anomalies
Dollar Tree (DLTR) continues to show strength post–Q1 FY2025 earnings, breaking higher as it pushes through its multi-price format transition and nears the Family Dollar divestiture. The stock is outperforming key peers (DG, TJX, COST) and trading above both the 50- and 200-day MAs — a signal of growing institutional confidence.
On the fundamentals: Net sales (ex-Family Dollar) jumped 11.3% to $4.64B, comps grew 5.4%, and gross margin expanded to 35.6% despite transitional headwinds. Full-year EPS was guided up to $5.15–$5.65, reflecting management’s conviction in sustained growth. Analysts responded by revising EPS to $6.12 (+13.5% YoY), validating the turnaround thesis.
Valuation-wise, DLTR remains notably underpriced. It’s trading at 16.66x forward earnings — well below the retail average and far cheaper than peers like COST (51.1x), TJX (26.9x), and DG (19.0x). The gap is especially compelling given DLTR’s momentum and shift toward higher-margin discretionary sales via the “3.0” format.
Unusual Activity Insight:
What caught my attention was a cluster of unusual options activity suggesting a short-term strangle strategy centered around the July 18 expiration — likely positioning for the stock to stay range-bound while capturing premium from elevated IV post-earnings. The structure and OI shifts imply smart money is playing both ends of the current price band.
Trading Range and Setup:
DLTR has been respecting a range between $92 and $102, consolidating after its post-earnings move. That behavior, combined with the flow signals, sets the stage perfectly for a defined-risk premium play.
My Approach: Iron Condor (July 18 Expiration)
- Sell 100 Call / Buy 105 Call
- Sell 95 Put / Buy 90 Put
This iron condor aligns with the projected range, offering attractive premium while keeping defined exposure. With theta working in our favor and volatility elevated, it’s a setup that thrives in quiet bullish chop — exactly what we’ve seen since the Q1 breakout

SWDY Neutral Zone AnalysisSWDY stock is in a neutral zone. There is a semi double bottom at the support line 80.742 that might encourage a bullish reversal pattern. In case of increasing it's expected to breach the resistance line 81.139 to reach the 81.209 then the 3rd at 81.420. In case of being a fake sign it'll break the support line at 80.742 to reach the 2nd at 80.578 then the 3rd at 80.531 points.

Navigating MSTR’s Price Swings: A Smart Options ApproachOverview
MicroStrategy (MSTR) has continued to capture market attention due to its aggressive Bitcoin strategy and significant stock price volatility. In 2025, MSTR surged 41% in one quarter but also reported a massive $4.22 billion net loss in Q1, raising concerns about long-term financial stability. Analysts remain divided, setting price targets ranging from $200 to $650, largely dependent on Bitcoin’s performance and broader market conditions.
Key Developments Impacting MSTR
✔ Bitcoin Exposure: MSTR maintains a large Bitcoin position, making its stock highly correlated to BTC’s price movements.
✔ AI Integration: The company is investing in AI-driven products, which could provide diversification outside of Bitcoin.
✔ Institutional View: Analysts remain split on MicroStrategy’s valuation due to its uncertain revenue model.
✔ Macro Volatility: Market-wide sentiment, interest rates, and crypto regulations will influence MSTR’s trajectory.
Options Strategy for the Week
🚀 Iron Condor Setup for June 6 Expiration
To capitalize on MSTR’s volatility while managing risk, an Iron Condor strategy is structured within a controlled range:
- Inner Range: Sell Calls at 395 and Puts at 335
- Coverage: Buy Calls at 415 and Puts at 315
✅ Objective: Profiting from sideways price movement while minimizing exposure to extreme volatility.
✅ Risk Management: If MSTR breaks above 415 or below 315, the long positions hedge against excessive losses.

EGX30 Current Region AnalysisEGX30 stock is currently in a neutral region. In case of falling, it's expected to break the support line 32,498.905 to reach then 2nd at 32,408.426 then the third at 32,376.503. In case of rising, it's expected to breach the resistance line 32,546.761, to reach then 2nd at 32,621.248 then the 3rd at 32,695.736

TMGH Neutral Zone AnalysisTMG Holding trend is currently in a neutral zone, which supports the EGX30 zone analysis, reflecting the investors' wait for updates to orient them on which trend to prepare for, whether buy or sell. In case of rising, it's expected to reach the resistance line 54.044, breaching it depends on the future news. In case of falling, it is expected to reach the support line 52.573, but fundamentally it's a far-off expectation according to its current state among the upcoming summer season and its widening ads.

#GOAT/USDT Short-Term Rally or Wave 5 Decline ?#GOAT/USDT is currently forming a descending channel with a 5-wave Elliott Wave structure. The price shows potential for a short-term upside move toward $0.69, which acts as a crucial resistance level at the upper boundary of the channel. If rejected at this level, the price may continue its downtrend toward $0.32, aligning with the lower channel boundary and Wave (5) target. Traders should watch for a breakout or rejection at $0.69, as it will determine the next significant move. A breakout could signal further bullish momentum, while rejection would confirm the continuation of the bearish trend. BYBIT:GOATUSDT.P

Gold's Hourly Chart - M_Top Breach @ 2513.25 - Recovery?
Hello,
I was saying all week that the USDX was going to be strong in it's recovery from selling off the past few weeks.
I didn't think the economic data was all that bad during Friday, I think the damage set-in once the USDX started to rally on the retest and close above 101.50. As the NY session opened on Friday I saw a lot selling of the Gold-price as the USDX was making a sustained rally above 101.50 and then it skipped back under this level and buying of the Gold-price started to occur but it was a bull-trap.
The Gold market sold off and as can be seen on the hourly chart a breach below 2513.25 and the selling intensified. It is always harder to navigate in real time, I get it.
You can see here on the hourly that the 200 EMA is starting to slope down and the 9 EMA is about to cross it.
But it's not all bad. When Asia opens on Monday there is a bullish Head n Shoulders that has formed on a 5 minute chart. (Please see below). Indications are that this will retest and execute taking the market higher. However, for the market to recover, buying will have to continue following this pattern to keep the Gold price above important key moving averages. Otherwise, this 5M pattern will play out bullishly for a time and the Gold price could sell off again. The Gold market got its liquidity during Friday, so lets see where price goes.

possible Head & shoulder patternthere is a possibility that nifty smallcap 250 can for a head and shoulder pattern here, which can bring it down by total of 11%, and 7.7% after the formation gets completed. It is very likely that the market will not complete this pattern, but just for awareness and availability of different perspective I wanted to post about it.
also, please do not take any decisions too quickly based on this as patterns are for very short term but in the long term I'm still very bullish on the midcap and smallcap index.

nasdaqThe provided code is an implementation of a grid strategy in Pine Script, a programming language specific to TradingView. Here's a breakdown of the code:
Strategy Settings: The code starts with defining the strategy parameters such as the strategy name, overlay option, pyramiding rule, quantity type, initial capital, currency, and commission settings.
Input Configuration: The code defines several input variables that control the behavior of the strategy. These inputs include options for using auto bounds or manual bounds, selecting the bound source (recent High & Low or Simple Moving Average), lookback period for auto bounds, deviation for auto bounds, and upper and lower bounds for manual bounds. There is also an input for the number of grid lines in the strategy.
Function to Calculate Grid Bounds: The f_getGridBounds function is used to calculate the upper and lower bounds of the grid. It takes inputs such as bound source, lookback period, deviation, and whether to calculate the upper or lower bound. If the bound source is set to "Hi & Low", the function calculates the bounds based on the highest high or lowest low in a specified lookback period. If the bound source is set to "Average", the function calculates the bounds based on a Simple Moving Average with the specified lookback period. The deviation parameter adjusts the bounds either outward or inward.
Function to Build Grid: The f_buildGrid function is responsible for constructing the grid. It takes inputs such as the lower bound, grid width, and the number of grid lines. The function iteratively adds the grid lines to an array using the lower bound and width.
Function to Get Nearest Grid Lines: The f_getNearGridLines function is used to find the indices of the nearest grid lines above and below a specified price. It takes the grid line array and the price as inputs and iterates through the array to find the relevant indices.
Variable Declarations: Several variables are declared to store the current upper and lower bounds, grid width, grid line array, order status for each grid line, and the nearest grid lines to the current price.
Grid Trading Logic: The main logic of the strategy is implemented in a for loop. It checks if the current price is below a grid line, there is no open order for that grid line, and it is not the last grid line. If these conditions are met, a buy order is placed for the corresponding grid line. Similarly, if the price is above a grid line and it is not the first grid line, a sell order is placed if there is an open order for the previous grid line. This logic allows the strategy to buy and sell at the grid lines.
Dynamic Grid Bounds: If the auto bounds option is enabled, the code updates the upper and lower bounds, grid width, grid line array, and nearest grid lines based on the current market conditions. This allows the grid to adapt to changing price levels.
Overall, this code provides a framework for implementing a grid trading strategy in TradingView using Pine Script. It allows for customization in terms of grid configuration, bounds calculation, and adaptability to market conditions.

$USO high P/L strangle +50% TP with options #oil #usoilI'm trading the pullback of course with neutral strangle.
Divergence on RSI, high IVR, optimal for neutral quick trade on micro oil futures.
Sold 1 /MCLZ3 MCOZ3 11/15/23 Call 95.00 @ 1.17 (delta21)
Sold 1 /MCLZ3 MCOZ3 11/15/23 Put 75.00 @ 1.06 (delta17)
This is an OIL 37DTE Strangle for 2.23cr (bit bullish delta overall)
37DTE Strangle for 2.23cr
Max Profit: $223
Req. BP: $600
PoP: 74%
IVR: 49 (very high, optimal for credit strategy)
My target is ~$100 on this trade in the next 2 weeks.

Maybe Wyckoff ??Hi there ;
to those of u who are familiar with Wyckoff, as i have just recently started getting into this type of analysis , maybe we can make some sense out of this market moves .
- it seems like phase A has been successfully accumulated supply and the diminished volume in mark-downs , make it seem promising .
- as now we enter phase B , we will attempt a rally up into 26300 key zone . then we'll see what's what in later idea updates that i'll provide .
Keep in touch !

Generating Income from NVDA ConsolidationDescription
NVDA has seen consistent gains following the upside break of its descending intermediate trendline on 17JAN. Now it seems to have settled into a consolidation pattern (Ascending Triangle) following the event-related runaway gap up through an ATH on 25May. Ascending triangles represent a healthy demand for a stock with a planned distribution at a particular price, which appears to be 480, and now we are now seeing the second rejection of the upper boundary of the pattern @482.
At the same time, DIA, SPY and IXIC have all seen retests and rejections of their 50D EMAs today. In general, I expect the continued fall in the indexes to keep NVDA in consolidation, despite consistent earnings outperformance.
Technical Indicators to signal the entry:
Ascending Wedge upper boundary second rejection.
Technical Risk Factors:
MACD 12 over 26 bullish cross
The expected price is <482 until breakout of the pattern.
I will be using short dated call credit spreads to:
Limit upside risk while maintaining a neutral position
take advantage of skewed earnings IV
Call Credit Spread
Levels on Chart
SL: 482 / or a minor that does not reach the ascending trendline at the bottom of the pattern
PT: <482
TP: @ expirations
*Stops based off underlying stock price, not mark to market loss
The Trade
BUY
8/25 487.5C
SELL
8/25 482.5C
R/R & Breakevens vary on fill.
Manage Risk
Only invest what you are willing to lose
I warrant that the information created and published by me on TradingView is not prohibited, doesn't constitute investment advice, and isn't created solely for qualified investors.

Time to be cautious on Titan (neutral)We are close to all time high for titan share and a big resistance is out there. I would book profit here and wait for the trend confirmation.
Two big probabilities:
1. Open and close above resistance means long.
2. Open and close below resistance is good chance to short.

PAY ATTENTION TO THE WEEKLY TIME-FRAME ON GOLDDear Traders
Whilst I see the obvious imbalance as well as the possibility of it being mitigated suddenly. Gold is still at risk of a sharp drop to the weekly supply zone with the possibility of closing the market gap created within the supply zone.
The best way to make money from this metal based on what I am seeing is to wait and see if the imbalance would get closed/mitigated or if there would be a sharp drop to the supply zone or even the weekly "ORDER BLOCK" just below the supply zone as the correction may not be over yet.
I am going to sell gold from anywhere between 2001-2022 or below from the supply zone with a reasonable lot size as I still see the possibility of the bullish order block being mitigated.
Having said all this, there are still opportunities for a short buy to 1951-1958 whilst waiting to see what happens next.

BTCUSDTBTCUSDT in weekly
RSI broke its upward trend line and moved down after the pullback
But the price has not yet reached its trend line and we expect it to move toward the trend line

HIL moving/consolidating in a channelNSE:HIL is moving sideways from last week. It takes support at the same price taken last time and resist at the same price taken at last time in 15 minutes timeframe.It is moving in a channel. The 50 and 200 moving average is aslo sideways. Wait for a good breakout with volume. It is good for taking trade for intrady trade. If it gives breakout we are going to get enter in the trade as per the situation.

woo usdt perpetual Hello fellow traders
Greetings from team Trading The Tides
lets talk about Woo which we been trading for the last 3 days and made around 30% in profits .
today as the FOMC is really close and there many crucial Data down the line .
First of all specifically today I don't see much buying in WOO , secondly Woo is creating more and more resistance to the upside , which make me think not to trade woo until it goes back to support and on atleast 15 min time frame creates a wick which in other sense gives idea about institution getting in to take the prices higher , so I will wait till then .
My second opinion about woo is to break the lows of the symmetrical triangle on 4h , 1h
and then we can plan a short trade again on the basis of breakdown structure with proper risk n reward .
I don't take more than 2% SL so if the trade goes opposite , I will accept the SL and look out for other opportunities .
Note :
I am just a technical , fundamental analyst and day trader .
Any info given is not a financial advice , i am only posting what i think is right , feel free to guide if u think i am wrong plz .
Thanks .

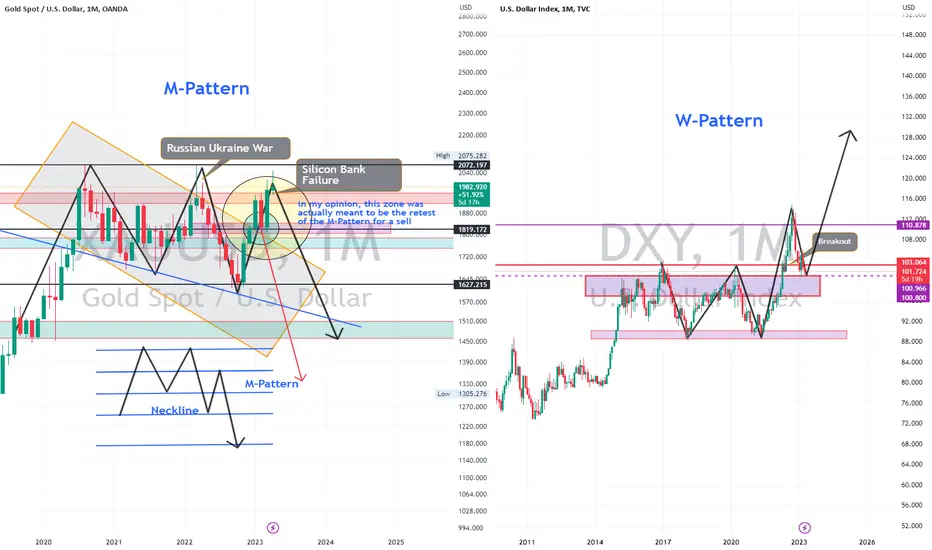
M-Pattern on Gold, W-Pattern on DXY - Where are they Going????Hello Traders,
Looking at Gold, I see the opposite of the DXY but not so clean because of I think we have seen two major fundamentals in the last 1 year (The Russian/Ukraine war & The Silicon Bank Failure) that may have impacted gold.
Going by M-Pattern price action Gold is a bit very tricky now, but I will sell Gold massively if I see a closure below the 1819 in the next couple of days or weeks but for now will be looking at bullish or bearish signals in lower time frames for entries.
Gold requires a lot of patience but if the W-Pattern, the break, and retest of previous resistance, now looking like a possible support on DXY, then, we might see gold get back to the 1600 zone and if that breaks, we may see 1451 zone. For now, let's trade careful and focus on price action and not what we think as traders.
Big decision point for Divis labI would like to watch which side it breaks out, from there I would like to take a call. I will try to stay neutral at this point.

Is this just a retest?What if the price is just retesting the broken trendline? The support looks very weak now but still not broken. We will see a lot of push back from bulls and bears but I would be very careful to go all in shorting or buying. Just sitting here and watching the show.
