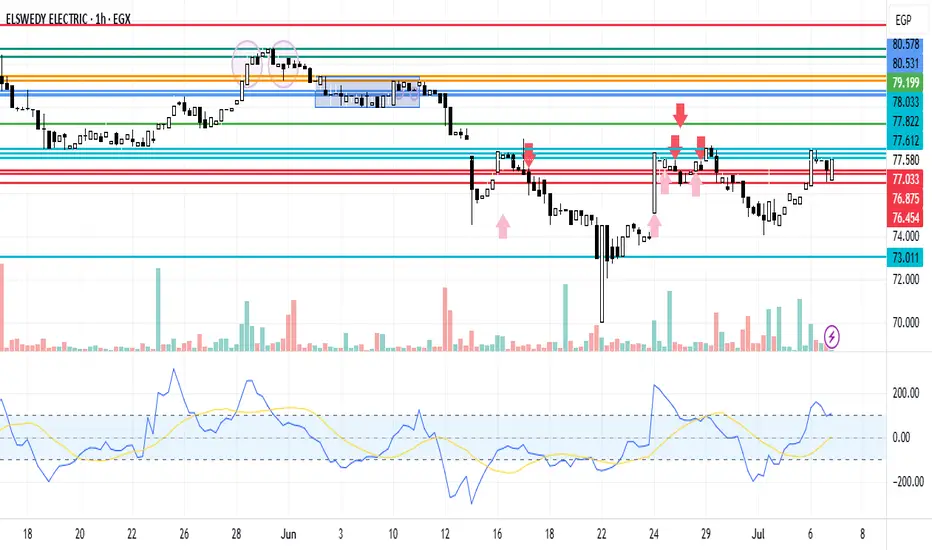
SWDY Neutral ZoneSWDY stock is in a neutral zone. In case of increasing, it's expected to breach the resistance line 77.612, 77.822 to reach 78.033. In case of decreasing, it's expected to break the support line 77.033, 76.875 to reach 76.454
Neutralzone
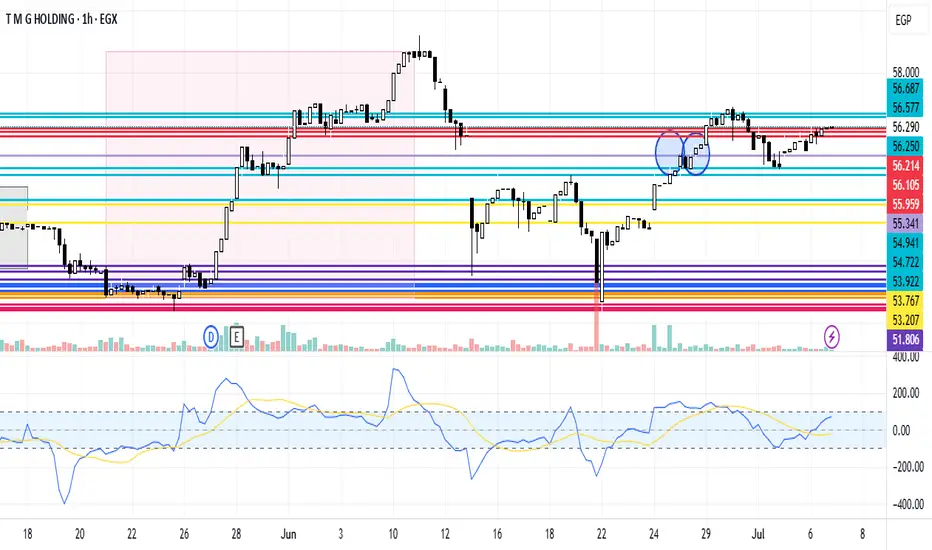
TMGH Neutral ZoneTMG Holding trend is in a neutral wave. In case of increasing it's expected to breach the resistance line 56.250, 56.577 to reach 56.687. In case of decreasing, it's expected to break the support line 56.214, 56.105 to reach 55.959
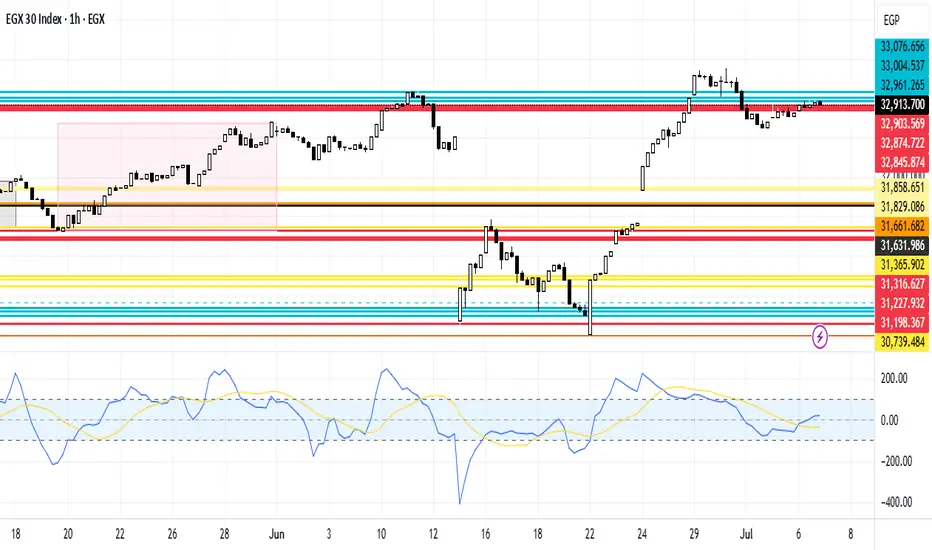
EGX30 Neutrality ZoneEGX30 stock is currently in a neutral region. In case of deceasing, it's expected to break the support line 32,903.569, 32,74.722 and 32,845.874. In case of increasing, it's expected to breach the resistance line 32,961.265, 33,004.537 then 33,076.656
Bitcoin simply doesn’t want to move.Bitcoin simply doesn’t want to move.
As we can see, Bitcoin re-entered the channel again in a bull trap, so as long as the price remains inside the channel, there won’t be any movement we can analyze to predict an upward move.
Let’s see what this week has in store. Hopefully, it breaks out again and this time decides to make the bullish run.
Thank you.

BTCUSD: Caution Despite Bullish TrendThe chart currently displays a rising wedge pattern on BITSTAMP:BTCUSD , a configuration often preceding a bearish reversal. Despite the recent price decline, the market trend is still upward, and prices are consolidating within the expected range.
Currently, the price is positioned in the middle of the wedge's range, indicating a neutral stance. Traders should monitor the price movement closely in the coming days for signs of either continuation or reversal.
After the high on November 9, the price action retraced to the 23.60% Fibonacci retracement level, a pattern that is seemingly repeating itself as we observe the current retracement.
The RSI indicator suggests that the market is potentially overbought, indicating exhaustion, which could lead to bearish divergence. However, there is still a possibility for the price to push upwards, challenging the resistance zone between $46,000 to $48,000 before any reversal could be confirmed.
From a trading perspective, the Bonsai indicator has not signaled a short position yet, hence our current long position. However, given the rising wedge formation, we are taking partial profits and closely monitoring for any indication of a trend reversal.
In terms of recent fundamental news, Bitcoin has seen a mix of potential bullish drivers, such as increased adoption by mainstream finance platforms and positive developments in blockchain scalability solutions. Yet, these factors don't guarantee continued price increases; past market cycles have shown that Bitcoin can experience significant corrections despite positive news.

Godrej Properties Intraday tradeThere is a symmetrical triangle formation on 30 Mins chart of godrej properties. Triangle can breakout above or below the respective trend lines. Wait for the candle to breakout and close above or below trend lines.
This will be very short term trade and should be completed in one or two trading sessions.
Breakout level above = 1400
Breakout level below = 1384
Target = + 20 or -20 above or below breakout level
stop loss = 2% below breakout levels

BTC - Update Last Analysis in 4H #BTC $BTC - Neutral ZoneDear Friends
This is a new update from the Last analysis in 4H.
Neutral Zone and descending trend line in daily and 4H.
wait for any breakout to down or up and I think we can find the best movements in the new year and next week.

Bitcoin 1 Hour scale in reference to the previous 4 Hour postSO, in regards to the 4 hour post and to further confirm the slight standstill, the 1 hour chart shows long wicks against the roof. In all honesty, beating that while being fresh out of the RSI seems rather difficult if there is no huge momentum going on. I suggest playing it safe on the option side of things and entering in accordingly such as finding verified rejections off of that platform. Play safe and stay calm.

$SE #SEALIMITED Stuck Between Two AVWAPs$SE is being supported by COVID-19 lows AVWAP (Aug 17, 2020) and rejected by ATH AVWAP (Oct 19, 2021). Until we break either AVWAP, I will be neutral and wait for some movement. I do like the stock long term in my Roth IRA, so I will be slowly adding shares if it goes near or retests the support AVWAP. As mentioned in my $BTC chart, I do believe that the bottom is in for growth stocks and the R/R is appropriate for going long.

NQ Power Range Report with FIB Ext - 12/21/2021 SessionCME_MINI:NQH2022
- PR High: 15732.75
- PR Low: 15671.00
Evening Stats (As of 11:40 PM)
- Gap: = N/A
- Session Open ATR: 336.27
- Volume: 32k
- Open Int: 211k
- Trend Grade: Neutral
- From ATH: -6.0% (Rounded)
Key Levels (Rounded - Think of these as a range)
- Long: 16391
- Mid: 15819
- Short: 15247
Keep in mind this is not speculation or a prediction. Only a report of the Power Range with Fib extensions for target hunting. Do your DD! You determine your risk tolerance. You are fully capable of making your own decisions.

When everyones looking for a target, be mindful of the range...I'd like to say that this will be an easy pennant / bull flag continuation rip up, but I'm not attempting any EXACT predictions here. It could very well in fact be time for consolidation. Not financial advice.

ETH USDT : Impulsive move or Pull back to previous levels?Hello guys, hope you are doing well.
Welcome to today's market analysis as a part of "Aglogains - Daily Trade series".
Ethereum is stuck in a range between 3200 - 2900 for the last 2 days, it looks like the market is consolidating here for a while given the fundamental news (US Infrastructure Bill) and other market factors.
Here are the two scenarios that could play out:
1. Either we need to see ETH breakout to form a new higher high and close above 3200, to confirm the continuation of the uptrend.
2. ETH could pull back to 2990 - 2900 levels to retest the support.
I suggest we wait until one of these scenarios plays out , if it does, here is how we can prepare to take advantage of the move.
Scenario 1: If ETH does breakout of 3200 with an impulsive move towards the upside confirming the continuation of the uptrend then, I would look for buying opportunities on the pullback @ 3160 - 3200
Scenario 2: If ETH goes down to the 2990 - 2900 levels to retest the support, I would pay close attention to any wick rejections or bullish engulfing candles to indicate buying pressure at these levels and enter a long trade here.
Let's see how the market plays this one out.
Do let me know if you have a different way to leverage the current price?

BTC thoughtsFor this analysis to be legit is needed bullish close and touch at least to 28K.
If that happens rally continues and everything goes like planned.
If not then S2F,RainbowChartBTC will fail, we have support at 20K and still a trendline in some-way.
Crypto will be less volatile in the future so every scary 50% drop is 100% profit chance, seems great right ?
It's money doubler in any way if you are new to crypto then you should hold and not be looking at the charts.
Price is lagging indicator of fake value, Because crypto is new and volatile nobody knows what's it's worth.
This idea is neutral, only time will tell.
One bearish thing is RSI. topped out at 91 points.
Crypto is the future.
Or the biggest Scam.
Choose it wisely.

LTC/BTC has me cautiously optimistic I'm observing LTC here as it has decisions to make. Either down, up or sideways. Speaking with fellow traders whom's opinions I respect and have more experience than I have. I've been warned that LTC seems to like to fake out. Thus I'm neutral on this and it definitely isn't a call . I'm not going to let the bullish signs of reversal I see put me in a long bias just yet. Rather I'll be using this as a learning experience and be following it's steps (hopefully gradually stepping up) . As the adage goes "Markets like to take the steps up and the window down".
FA observations:
1. It's been in price discovery for a while looking for it's bottom ;)
2. It's bounced off the support line and may be forming a V bottom reversal and could possibly look to put in a HL from here
3. I'm seeing bulls stepping in and buying these lows
I'm publishing this idea so that I may keep it in the back of my mind and maybe in yours? I do think when LTC starts moving it's going to be one for the books. And with that I would like to wish everyone a happy Easter and do spend this time with loved ones (especially parents, while you still can)
# Obligatory Disclaimer
My ethos at the onset is best described by the following acronym K.I.S.S (Keep it simple stupid) I use this mantra to ground myself, because nobody "outsmarts" the markets, even the legends only had a big brain understanding of them, you will always be the student. Make peace with that fact. Also I'll be sticking with simple charts that show my analysis of assets and won't be cluttering with the indicators I'm using, I'm not an educator. There are many other education channels here on TV and great senpai's curating them. If most of what I said above doesn't make sense, my advice is don't put your hard earned money in ( And most importantly none of this is financial advice, don't come crying and moaning at me if/when you lost your lunch money! )
And with that ladies and gents , always K.I.S.S before you get F'd

EURZD is interesting for practice and educationEURNZD looks amazing for buy and for sell at the moment. We have to be careful here because, every wrong mindset can take a part of our stake. As a trader, your job is to ignore your hopes and picture you are looking at first moment, but focus on facts and find all kinds of data we learned in Elitefxacademy educational program.
In this case, we have to know that sellers are dominating overall trend and overall territory but buyers did a great job and push price to our H1 Sell players. Those sell players are ignoring buyers and are not interested at price they want to acknowledge.
If this is true, buyers are able to break H1 players and continue their ''hopefull buy'' to H4 players.
If this is not true, sellers has to break 1.72728 support level buyers have just maintaining at. If sellers will do this then their first target is at 1.71663 which is second support level.
For more details acknowledge this analysis based on what we taught you in our Elite program and give us feedbacks.
Elite traders, learn, practice and stay educated.
Elitefxacademy

Starbucks is still very much bullish, possibly.Sbux, as you can see is still in a very bullish price action range. It has fell to a critical level in my opinion, it has to hold this range and move upwards, that would signify some good strength towards the next resistance and support zones. We could see a run up until earnings. This upcoming week will be critical to determine if the trend is changing.

AUD/NZD SETUPAUD/NZD setup triangle chart pattern setting buy orders at both potentials and removing the other when one is hit as the chats indecisive

Neutral ! better to stay away The Market is Neutral ..likely to range for while between 2960 and 2780 ...with a bullish outlook for the next 6 months till the RSI confirmation .. if SPX and ES close today bellow 2800 then I'm short on it till 2650'sh level ... the lowest risk way to make money for now is playing price action on hourly bases . "there is time to go long time to go short and time to go to fish "

EURGBPHello Traders
Today looking at EURGBP we see too possible directions as always.
We currently sit at a resistance level of 0.88000
Price can push up from here
Price can retrace to 0.87 and then begin climbing from there
So what seems more likely?
Not sure. 0.87 has been a great support/resistance level on weekly, but as has 0.88.
So I'll leave you, with this! React to the market, the market will not react to you!
Follow me for updates during the week and join the discussions on Telegram with "Quickpips Free Chatgroup" - I'll put the link on my status! :)
Happy trading
Roo :)
Please remember I am a hobby trader, this is not financial advice and any losses or gains are your own!
Be sure to like and comment on the chart and follow me on trading view.

SPX ShortWatch for the pattern to play out and then for an eventual break-- downside long term, indifferent if pattern fills. as this level may be a nice time to consolidate and drop premium prices... Again, bearish overall.

10Y T-NOTES : EARLY
Here is the situation that resembles gold and silver.
It is early to speak of a complete negativity, only a loss of power in the positive region.
The RSI channel is in a strong image.
It's a little early for the short.
There are new hills up there.
I need at least stochrsi's approval for the long.
I think the bottom of the middle band for the short position.
This instrument is the most traded future.
So I felt the need to share.

The BIGGER PICTURE of CADCHFSo guys, here's the weekly outlook of Canadian/Swiss Franc. The structure tells us that price is contained in the channel, so this confirms that the next leg is gonna be bullish one and then so on...

S&P 500: Market at decision point between rally or mild pullbackIf the "S&P 500" breaks above 2815, then the rally is going to continue strongly higher for months. But if the "S&P 500" declines and stays below 2725 until the end of August then there remains a risk of a large stock market crash.
Short-term the market is oversold and could break out above 2800 or a little higher towards 2815.
Mid-term the market is way too overbought. Therefore there is a risk of a pullback down to 2750 or lower.
Long-term the market is neutral at a tipping point here. Due to this divergence between the short-term and mid-term trends.
