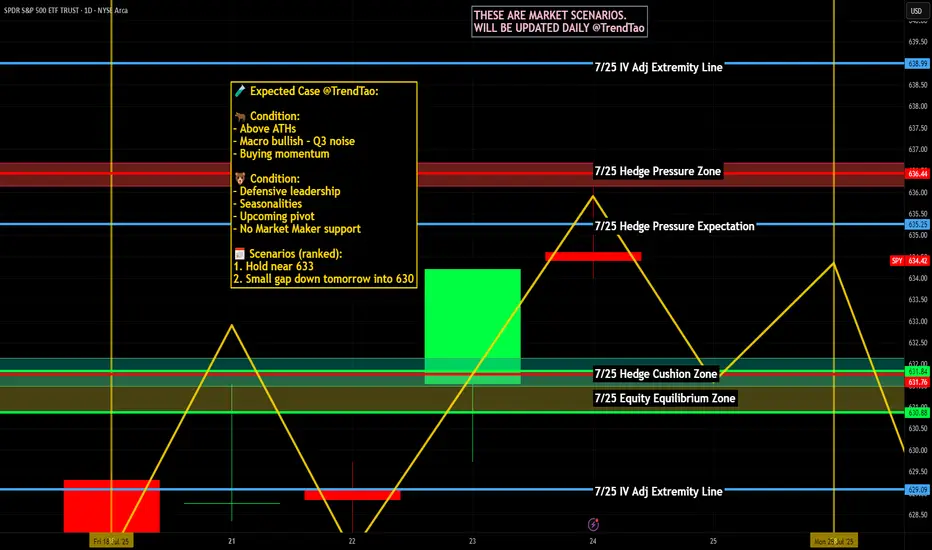
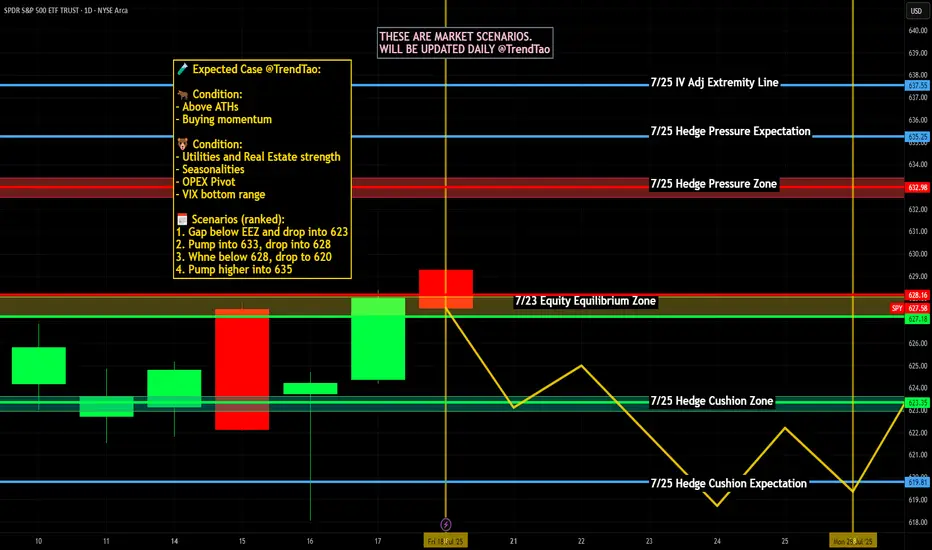
Nightly $SPY / $SPX Scenarios for July 25, 2025🔮 Nightly AMEX:SPY / CBOE:SPX Scenarios for July 25, 2025 🔮
🌍 Market‑Moving News 🌍
🏔️ Copper Market Flashpoint
Following President Trump’s announcement of steep copper tariffs (15–50% range), U.S. copper futures surged, then sharply reversed. Inventory arbitrage between CME and LME markets surged, distorting pricing dynamics and triggering concern over metal market stability.
🇪🇺 EU–China Summit Signals Trade Reset
EU leaders concluded their 25th summit with China, fostering deeper economic and strategic ties. Observers expect follow-up on mutual trade agreements, particularly regarding tech and sustainability sectors.
🌍 EM Equity Rally Consolidates Gains
Emerging markets continue to outperform global equities in 2025—with MSCI EM up ~18% vs. S&P 500. Analysts highlight strong opportunities in AI/fintech stocks in China and Latin America, suggesting further rotations out of U.S. markets.
📊 Key Data Releases & Events 📊
📅 Friday, July 25:
8:30 AM ET – Durable Goods Orders (June):
Forecast shows a sharp drop (~–10%), following a ~16% gain in May—signaling possible cooling in business-related equipment purchases.
10:00 AM ET – U.S. Imports of Steel Products (June):
Trade-data release monitoring steel flows amid evolving tariff frameworks.
All Day – Corporate Earnings Reports:
Companies such as First Financial Bancorp (FFBC), HCA, AON, Charter, and others report earnings. Outlooks may influence small- to mid-cap sentiment.
⚠️ Disclaimer:
This report is for educational and informational purposes only—not financial advice. Always consult a licensed financial advisor before making investment decisions.
📌 #trading #stockmarket #economy #data #earnings #commodities #EM #technicalanalysis
NEWS
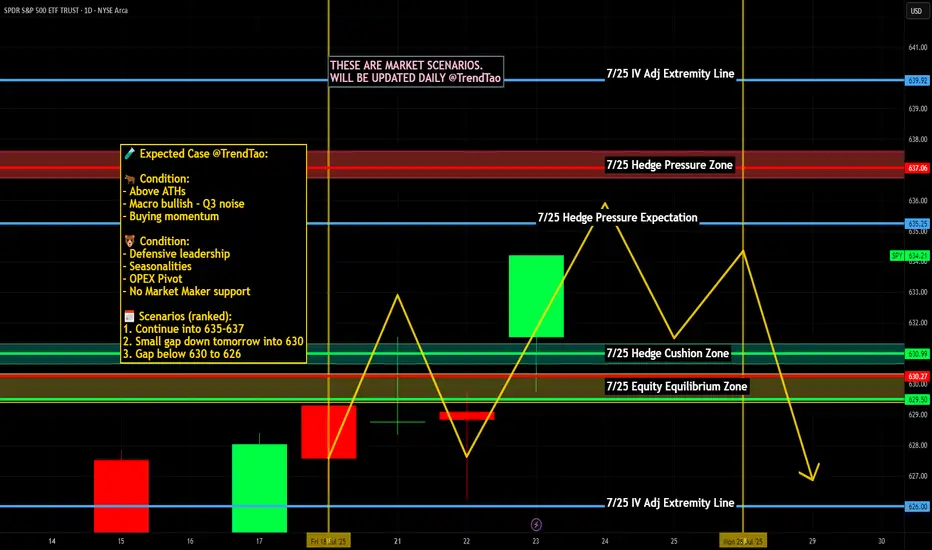
Nightly $SPY / $SPX Scenarios for July 24, 2025🔮 Nightly AMEX:SPY / SP:SPX Scenarios for July 24, 2025 🔮
🌍 Market-Moving News 🌍
🤝 U.S.–EU & U.S.–Japan Trade Optimism Lifts Sentiment
The S&P 500 and Nasdaq hit record-high closes on July 23, fueled by optimism over a potential U.S.–EU trade deal mirroring the U.S.–Japan framework, with the EU-set tariff on autos potentially halved to 15%
💵 Dollar Retreats, Yields Climb
As markets shifted toward risk assets, U.S. Treasury yields increased and gold softened, while the dollar eased—highlighting growing confidence in trade-driven growth news
🏦 Fed Independence Under Pressure—But No July Cut Expected
A Reuters poll shows economists see heightened political pressure on the Fed jeopardizing its independence, though the consensus remains that rates will stay unchanged this month
📊 Key Data Releases & Events 📊
📅 Thursday, July 24:
8:30 AM ET – Initial Jobless Claims
Weekly tally of new unemployment benefit applications—key indicator of labor-market conditions.
10:00 AM ET – New Residential Sales (June)
Tracks signed contracts for new homes, offering insight into housing demand under tightening mortgage rates.
All Day – Trade Headlines & Fed Watch
Continued focus on U.S.–EU trade developments and any follow-up to Fed independence concerns from policy circles.
⚠️ Disclaimer:
This information is for educational and informational purposes only—not financial advice. Please consult a licensed financial advisor before making investment decisions.
📌 #trading #stockmarket #trade #economy #Fed #housing #jobs #technicalanalysis
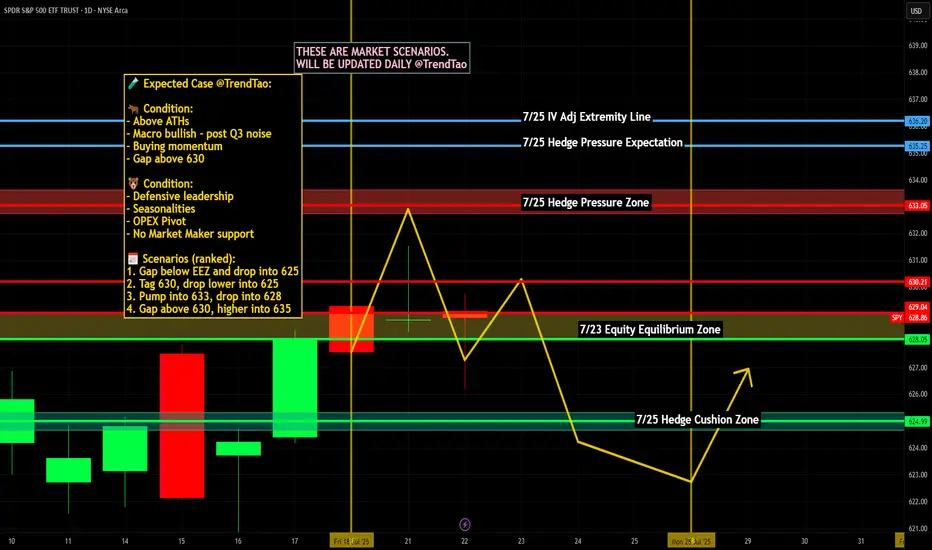
Nightly $SPY / $SPX Scenarios for July 23, 2025🔮 Nightly AMEX:SPY / SP:SPX Scenarios for July 23, 2025 🔮
🌍 Market-Moving News 🌍
📈 Morgan Stanley Stays Bullish
Morgan Stanley reaffirmed its optimistic view, forecasting the S&P 500 will reach 7,200 by mid‑2026. They cited strong earnings and anticipated rate cuts as key drivers, though warned of risks from rising Treasury yields and tariff-related cost pressure
📉 Inflation Debate Reignites
A renewed debate is underway regarding whether tariffs are "transitory" or persistent inflation drivers. Treasury counselor Joseph Lavorgna argued tariff impacts will be one-off, while others caution long-term price pressures may persist, complicating Fed policy directions
🏛️ Calls for Fed Reform Intensify
Treasury Secretary Scott Bessent suggested structural reforms to the Federal Reserve could have greater long-term impact than removing Chair Powell, highlighting ongoing concerns over central-bank governance amid political criticism
💳 Investors Shift to Corporate Bonds
As equity valuations have surged, investors are reallocating toward investment-grade corporate bonds, reducing credit spreads to the tightest levels since 1998—a sign of elevated risk appetite balanced with caution
📊 Key Data Releases & Events 📊
📅 Wednesday, July 23:
(No major U.S. economic releases)
Market focus remains on tech earnings (Tesla, Alphabet) and Fed signals following Tuesday’s Powell address.
⚠️ Disclaimer:
This information is for educational/informational purposes only and does not constitute financial advice. Please consult a licensed financial advisor before making investing decisions.
📌 #trading #stockmarket #economy #tariffs #Fed #earnings #corporatebonds
Nightly $SPY / $SPX Scenarios for July 22, 2025🔮 Nightly AMEX:SPY / SP:SPX Scenarios for July 22, 2025 🔮
🌍 Market-Moving News 🌍
🚀 Tech & EV Stocks in Focus Ahead of Earnings
Futures were quiet ahead of Tuesday’s open, but key movers included Astera Labs (+19%), Alphabet (+2.7%), Netflix +2%, and Robinhood –4.9% after being passed over for the S&P 500. Investors are positioning ahead of major tech and EV earnings this week — including Tesla, Alphabet, Lockheed Martin, Coca‑Cola, and Honeywell
📣 Powell Speech Eyed for Rate Clues
Fed Chair Jerome Powell is set to speak at 8:30 AM ET today at the Integrated Review of the Capital Framework for Large Banks Conference in D.C. Markets will be watching for any indications on future interest rate direction
🌏 Japan’s Political Shift Has Little Market Impact
Japan’s ruling coalition lost its upper-house majority over the weekend, but markets remained stable as it was largely expected. The yen held steady, and Asian equities stayed calm amid the holiday—focus remains on upcoming corporate earnings
📊 Key Data Releases & Events 📊
📅 Tuesday, July 22:
8:30 AM ET – Powell Speech: Key address at the bank regulation conference. Tone and forward guidance may sway bond and equity markets.
After Market Close – Alphabet & Tesla Earnings: Heavyweights due today—market attention will track revenue guidance, especially on advertising, EV demand, and AI.
⚠️ Disclaimer:
For educational and informational purposes only. Not financial advice—consult a licensed advisor before making investment decisions.
📌 #trading #stockmarket #tech #Fed #earnings #AI #infrastructure #volatility
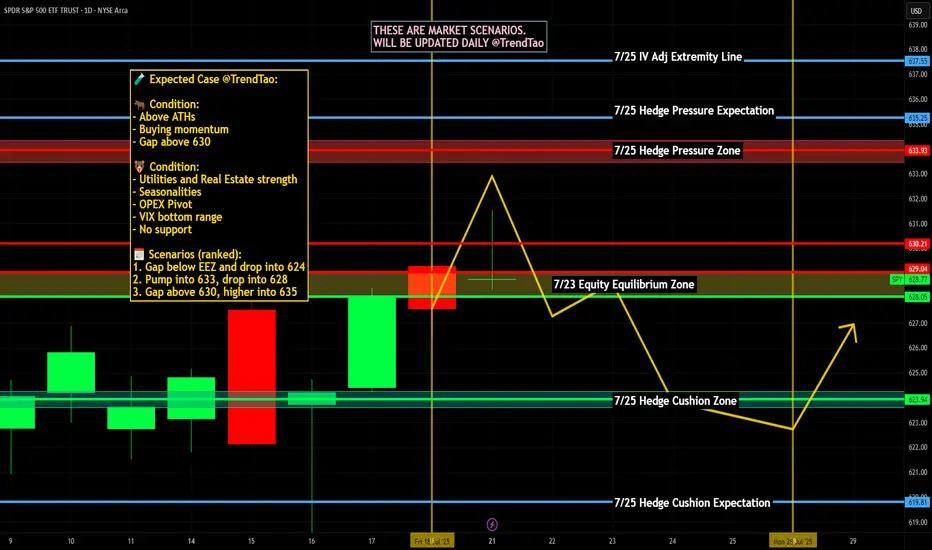
Weekly $SPY / $SPX Scenarios for July 21–25, 2025🔮 Weekly AMEX:SPY / SP:SPX Scenarios for July 21–25, 2025 🔮
🌍 Market-Moving News 🌍
🏦 Fed Chair Powell Speaks — Markets Key Into Tone
Federal Reserve Chair Jay Powell’s Jackson Hole speech is the week’s centerpiece. Markets will be closely listening for clues on inflation strategy, rate-cut timing, and sensitivity to geopolitical inflation drivers like tariffs.
📦 Tariff Deadlines Gain Spotlight
Multiple tariff deadlines are set this week for targeted trade partners including the EU, Mexico, Canada, Japan, South Korea, and Thailand. Any new announcements or extensions could trigger volatility in trade-exposed sectors.
🛢️ Oil Market Mixed Signals
Brent crude prices have stabilized near mid-$70s, but OPEC+ discussions regarding supply extensions and global growth concerns continue to inject uncertainty into energy-linked equities.
📈 Big Tech Earnings Kick Off
The “Magnificent Seven” tech giants begin reporting: Nvidia leads on Tuesday, followed by Microsoft, Amazon, Alphabet, and Meta later in the week. Expect significant sentiment swings based on forward commentary.
📊 Key Data Releases & Events 📊
📅 Monday, July 21
Quiet session ahead of a packed week of speeches and data.
📅 Tuesday, July 22
8:30 AM ET – Existing Home Sales (June):
Measures signed contracts on previously owned homes—a key housing indicator.
After Market Close – Nvidia Q2 Earnings:
Market will watch guidance and China commentary.
📅 Wednesday, July 23
8:30 AM ET – Leading Economic Indicators (June):
An early gauge of U.S. economic momentum.
📅 Thursday, July 24
8:30 AM ET – Initial & Continuing Jobless Claims:
Labor-market health indicator.
📅 Friday, July 25
8:30 AM ET – Durable Goods Orders (June):
Signals demand for long-lasting goods, often driven by business spending.
8:30 AM ET – New Home Sales (June):
Follows existing home data for housing sector insight.
4:00 PM ET – Fed Chair Powell Speech at Jackson Hole:
Expect commentary on inflation, growth, and rate-path clarity.
⚠️ Disclaimer:
This content is for educational and informational purposes only and should not be construed as financial advice. Consult a licensed financial advisor before making investment decisions.
📌 #trading #stockmarket #economy #Fed #earnings #housing #durablegoods #JacksonHole #technicalanalysis
Nightly $SPY / $SPX Scenarios for July 17, 2025🔮 Nightly AMEX:SPY / SP:SPX Scenarios for July 17, 2025 🔮
🌍 Market-Moving News 🌍
🇮🇳 India–U.S. Inflation Divergence Dampens Dollar
India’s June retail inflation tumbled to a six-year low, while U.S. CPI hit its fastest pace since February—driven by tariff effects. This divergence is weakening the U.S. dollar against the rupee, pushing down dollar‑rupee forward premiums
📜 Treasury to Ramp Up T-Bill Issuance
Following the recent debt-ceiling increase, the U.S. Treasury plans to issue over $1 trillion in T-bills over the next 18 months. Money-market funds, flush with cash, are expected to absorb the supply, which could influence short-dated yields
💱 Dollar Eases Amid Fed-Related Volatility
Headline news that President Trump “highly unlikely” to fire Fed Chair Powell, coupled with stable PPI data, calmed markets. The dollar dipped slightly after earlier turmoil, while gold and bonds saw modest gains
📊 Key Data Releases & Events 📊
📅 Thursday, July 17:
(No major U.S. economic releases)
Markets will track T-bill issuance plans, dollar forward dynamics, and statements from the Treasury and Fed regarding debt and rate strategy.
⚠️ Disclaimer:
This is for educational purposes only—not financial advice. Consult a licensed financial advisor before making investment decisions.
📌 #trading #stockmarket #economy #dollar #tbills #inflation #Fed #technicalanalysis
Nightly $SPY / $SPX Scenarios for July 16, 2025 🔮 Nightly AMEX:SPY / SP:SPX Scenarios for July 16, 2025 🔮
🌍 Market-Moving News 🌍
📈 Record Bullish Sentiment Signals Rotation
Bank of America reports the most bullish fund-manager sentiment since February. With 81% expecting one or two Fed rate cuts this year, the group sees a rotation strategy replacing outright selling, with investors tipping toward sector shifts over wholesale exits
⚠️ Trump’s Fed Attacks Stir Policy Concerns
President Trump’s public criticism of Fed Chair Powell—calling for steep rate cuts and threatening removal—has raised market alarms over the central bank’s independence. Analysts warn such interference could destabilize confidence in U.S. monetary policy
🏦 Banks Prepare for Earnings Surge
Major U.S. banks are expected to report strong Q2 results this week. Enhanced trading and investment banking revenues are forecasted to offset economic uncertainties tied to tariffs
📡 Nvidia CEO to Visit Beijing
Jensen Huang is set to hold a high-profile media briefing in Beijing on July 16, signaling continued emphasis on China for Nvidia despite U.S. export restrictions—potentially a key narrative for tech markets
📊 Key Data Releases & Events 📊
📅 Wednesday, July 16:
8:30 AM ET – Producer Price Index (June)
Gauges wholesale inflation pressures; June expected +0.2% MoM vs May’s +0.1%
9:15 AM ET – Industrial Production & Capacity Utilization (June)
Monitors factory and utilities output and usage rates—key for industrial-sector health
Jensen Huang in Beijing
Nvidia CEO to lead media briefing in Beijing—a potential market mover for chipmaking and AI sectors
⚠️ Disclaimer:
This info is for educational purposes only—not financial advice. Consult a licensed professional before making investment decisions.
📌 #trading #stockmarket #inflation #Fed #tech #industrial #PPI
Nightly $SPY / $SPX Scenarios for July 15, 2025🔮 Nightly AMEX:SPY / SP:SPX Scenarios for July 15, 2025 🔮
🌍 Market-Moving News 🌍
📦 Dow Futures Dip on New Tariff Announcements
President Trump announced new 30% tariffs on EU and Mexico, with additional duties on Japan, South Korea, Malaysia, Kazakhstan, South Africa, Laos, and Myanmar starting August 1. Dow, S&P, and Nasdaq futures each slipped ~0.3% as markets assess inflation risk ahead of key CPI data this week
📈 Tech & AI Stocks Lead Despite Tariffs
Stocks like Circle (+9.3%), CoreWeave (+5.2%), Palantir (+5%), Roblox (+5.8%), and Shopify (+4.1%) surged, showcasing sector resilience amid broader tariff fears
⚠️ Deutsche Bank Warns of Summer Volatility
With thin market liquidity and rising geopolitical tension (tariff deadline Aug 1), Deutsche Bank flags summer as a period prone to sudden corrections
📊 Key Data Releases & Events 📊
📅 Tuesday, July 15:
8:30 AM ET – CPI (June)
Core CPI is projected at +0.3% MoM (2.7% YoY) and headline CPI +0.3% MoM—signs tariff effects may be feeding into prices
8:30 AM ET – Core CPI (June)
Expected to come in around 3.0% YoY.
8:30 AM ET – Empire State Manufacturing Survey (July)
Forecast: –7.8 (less negative than June’s –16.0) — a modest sign of stabilizing factory conditions
Fed Speakers Throughout the Day
Watch for commentary from Fed officials (Michael Barr, Barkin, Collins, Logan) for fresh insights on inflation and monetary policy
⚠️ Market Interpretation:
Inflation Watch: A hotter-than-expected CPI could delay anticipated rate cuts and lift yields. A pick-up in core CPI above 3% would be a red flag.
Growth Signals: A less-negative Empire State reading may suggest improving industrial momentum but still signals contraction.
Political Risk: Tariff escalation could shift investor appetite, even if markets right now are focusing on broader macro narratives.
Volatility Setup: The combination of thin liquidity, tariff uncertainty, and critical data makes for a potentially choppy week.
📌 #trading #stockmarket #economy #inflation #tariffs #Fed #CPI #manufacturing #technicalanalysis

BTC/USDT HIDDEN PATTERN! SM, FIB AND MORE COMFIRMED!Price Resilience Amid Geopolitical Stress
Bitcoin demonstrated remarkable strength during the Israel-Iran conflict, briefly dipping to ~$98K but swiftly rebounding above $105K. This aligns with historical patterns where BTC initially sells off on geopolitical shocks but recovers aggressively within weeks, outperforming gold and equities by 15-60% post-crisis. There is a $96K-$94K "footprint" that coincided with institutional accumulation, evidenced by $1.37B in spot ETF inflows during the conflict week, led by BlackRock's IBIT ($240M single-day inflow) according to official information. This institutional backstop and many others might single-handedly prevented a deeper correction for now, remember that smart money psychology is to create cause out of thin air and buy during selling and indecisive times.
Critical Levels to Watch
Immediate Support: $108k area is vital. A sustained hold here maintains short-term bullish momentum. The 50-day SMA near $102.8K (tested during June 13 conflict sell-off) remains a macro support floor.
Resistance & Targets: The $112K ATH is the near-term ceiling. Breaking this requires stronger spot demand—currently, net exchange inflows are negative, indicating weak retail participation or traders that are backing off for now.There's a $120K target (0.618 Fib) aligned with Standard Chartered’s $150K year-end model if ETF inflows persist.
Risk Zones: A close below $108.3K risks a slide to $105K. Failure here opens path to $96K and a further break of this 92k to 96k zone could lead directly to 70k area or even lower if economical and social activities are not favorable in the near to medium future.Dominance above 55% (currently 65%) delays alt season, but a break below 60% could ignite alts in a positive way.
Macro Catalysts & Market Sentiment
Policy Tailwinds: Trump’s "One Big Beautiful Bill" (proposing $5T debt ceiling hike and U.S. strategic BTC reserves) could weaken the USD, boosting BTC’s "digital gold" narrative. DXY’s -9% YTD drop already correlates with BTC’s 54% post-election rally.
Fed Influence: Pressure to cut rates (amid cooling employment data) may accelerate institutional rotation into BTC. ETF inflows hit $2.75B in late June, signaling renewed institutional FOMO.
Geopolitical Cooling: Iran-Israel ceasefire talks reduced immediate panic, but residual volatility risk remains. Traders note BTC often rallies 20-40% within 60 days of conflict events.
Structural Challenges
Liquidity Fragility: Whale moves (for example: 10K BTC sell orders) now impact prices more due to ETF-driven liquidity concentration. Recent $98K flash crash exemplified this.
Regulatory Overhang: MiCA compliance costs in the EU and U.S. security-reclassification proposals could pressure smaller tokens, though BTC’s status appears secure 28.
Seasonal Slump: July historically sees 6.1% of annual crypto volume—low volatility may delay breakouts until August 4.
Strategic Outlook
A July breakout above $112K could ignite the next leg to $120K, but a retest of $107K-$105K is likely first. Altcoins remain subdued until BTC dominance breaks <55%—select projects with institutional backing (for example, ETF candidates) or real-world utility for asymmetric opportunities.
Conclusion: BTC’s resilience amid chaos confirms its institutional maturity. Trade the $108.3K-$112K range aggressively, with a break above ATH targeting $120K by September. Always hedge tail risks (escalations, regulatory shocks) in this volatility-rich asset class. While this great surge in institutional inflow is good for BTC it also indicates a reduction or slower pace of other crypto currencies.
This is my analysis for BTC, let me know what you think and I hope you like it!

Weekly $SPY / $SPX Scenarios for July 14–18, 2025🔮 Weekly AMEX:SPY / SP:SPX Scenarios for July 14–18, 2025 🔮
🌍 Market-Moving News 🌍
⚖️ Powell Faces ‘Epic’ Trade‑Inflation Dilemma
Former Fed economists warn Chair Powell is navigating nearly unprecedented terrain: tariffs are pushing up prices even as the labor market cools. Striking a balance between inflation control and growth support remains a formidable challenge
📊 Tariff‑Driven Inflation May Peak This Week
June’s CPI is expected to show a 0.3% month-on-month increase, potentially lifting core inflation to ~2.7%—its highest level in 18 months. These data will heavily influence the Fed’s decision-making process
🏦 Big Bank Earnings Kick Off
Earnings season begins with JPMorgan ( NYSE:JPM ), Goldman Sachs ( NYSE:GS ), Wells Fargo ( NYSE:WFC ), and Citigroup ($C) reporting. Strong results could offset trade and inflation anxieties; expect volatility in financials
📈 Goldman Sees Broader S&P Rally
Goldman Sachs projects the S&P 500 to climb roughly 11% to 6,900 by mid‑2026, underpinned by firm earnings and expected Fed rate cuts. But warns that breadth remains narrow, increasing downside risk without robust participation
⚠️ Summer Volatility Risk Lingers
Deutsche Bank warns that summer’s low liquidity and the looming Aug 1 tariff re‑imposition deadline may spark sudden market turbulence—even amid bullish sentiment
📊 Key Data Releases & Events 📊
📅 Monday, July 14
Quiet start—markets digest back-to-back CPI, tariffs, and clearing post‑earnings.
📅 Tuesday, July 15
8:30 AM ET – Consumer Price Index (June)
Watch for potential tariff impact in CPI; core inflation data are crucial.
8:30 AM ET – Core CPI (June)
10:00 AM ET – Empire State Manufacturing Survey (July)
Early view on Northeast factory trends.
📅 Wednesday, July 16
8:30 AM ET – Producer Price Index (June)
Wholesale inflation signals to validate CPI trends.
10:00 AM ET – Housing Starts & Building Permits (June)
📅 Thursday, July 17
8:30 AM ET – Initial & Continuing Jobless Claims
A gauge on labor-market resilience amid talks of cooling.
📅 Friday, July 18
10:00 AM ET – Federal Reserve Beige Book Release
Fed’s regional economic snapshot ahead of next FOMC.
⚠️ Disclaimer:
This is for educational/informational use only—not financial advice. Consult a licensed professional before investing.
📌 #trading #stockmarket #economy #tariffs #inflation #earnings #Fed #CPI #technicalanalysis

EURGBP - Follow The Bulls!Hello TradingView Family / Fellow Traders. This is Richard, also known as theSignalyst.
📈EURGBP has been overall bullish trading within the rising channel marked in blue. And it is currently retesting the lower bound of the channel.
Moreover, the orange zone is a strong daily support.
🏹 Thus, the highlighted blue circle is a strong area to look for buy setups as it is the intersection of the lower blue trendline and support.
📚 As per my trading style:
As #EURGBP approaches the blue circle zone, I will be looking for bullish reversal setups (like a double bottom pattern, trendline break , and so on...)
📚 Always follow your trading plan regarding entry, risk management, and trade management.
Good luck!
All Strategies Are Good; If Managed Properly!
~Rich
Disclosure: I am part of Trade Nation's Influencer program and receive a monthly fee for using their TradingView charts in my analysis.

Nightly $SPY / $SPX Scenarios for July 11, 2025🔮 Nightly AMEX:SPY / SP:SPX Scenarios for July 11, 2025 🔮
🌍 Market-Moving News 🌍
🏦 Strong Bank Earnings Amid Tariff Churn
Next week’s Q2 forecasts point to robust earnings from U.S. banks—JPMorgan, Citi, Bank of America, Goldman Sachs, Morgan Stanley, and Wells Fargo—as trading and investment-banking revenue recover, offsetting uncertainties from ongoing tariffs
💬 Dimon Flags Fed Risk Pricing
JPMorgan’s Jamie Dimon cautioned that markets may be underestimating upside in interest rates. He sees a 40–50% probability of higher U.S. rates, driven by inflation from tariffs, migration, and fiscal deficits
⚖️ Tariff “Scattergun” Sparks Sector Disconnect
Trump’s plans to levy up to 200% tariffs on pharma and 50% on copper triggered uneven market reactions—copper prices rose 30% in six months, while European drugmakers remain flat, highlighting divergent sector sensitivities
📉 Tech & Macro Still Bullish
Despite policy turbulence, Nvidia climbed back above a $4 trillion valuation, and JPMorgan projects a $500 billion inflow into equities in H2—supporting gains even as broader macro pressures linger
📊 Key Data & Events
📅 Friday, July 11:
(No major U.S. economic data scheduled)
Markets will focus on bank earnings previews, tariff headlines, and the hold of the tech rally into a thin summer trading week.
⚠️ Disclaimer:
This information is for educational and informational purposes only and should not be construed as financial advice. Always consult a licensed financial advisor before making investment decisions.
📌 #trading #stockmarket #economy #tariffs #banks #tech #Fed #investing

Nightly $SPY / $SPX Scenarios for July 10, 2025🔮 Nightly AMEX:SPY / SP:SPX Scenarios for July 10, 2025 🔮
🌍 Market-Moving News 🌍
🏦 Global Banks Profit from Tariff Volatility
Major banks like JPMorgan, BofA, and Citigroup are expected to see ~10% growth in trading revenue in Q2, fueled by volatility from President Trump’s tariff policy shifts. Treasury trading volumes hit record highs as markets priced in policy swings
📈 S&P 500 Nears Lull Amid Bull Market Strains
Despite record highs in 2025, investors are warning that the rally may be reaching its limit. Bullish sentiment is strong, but analysts caution that sluggish consumer spending, rising inflation from tariffs, and few rate-cut signals from the Fed could cap downside momentum
🐻 Bear Case Gains Ground
Stifel’s Barry Bannister projected a potential ~12% correction in the second half of 2025. Key risks include slowing consumer spending, weak capital investment under tariff uncertainty, and persistent core inflation above 3%, negatively impacting earnings and growth outlooks
⚖️ “One Big Beautiful Bill” Could Add Trillions in Debt
The new fiscal package signed July 4 will add $3–4 trillion to national debt over the next decade while extending tax cuts and revising EV incentives. Bond market and Fed policy implications may become more pronounced if growth fails to keep pace
📊 Stocks vs Bonds: Diverging Signals
While equities climb and megacaps extend gains, Treasury yields have risen five days straight—signaling growing caution over real growth prospects. The yield curve steepening hints at mixed signals: growth optimism in stocks, but bond market signaling economic risk ahead
📊 Key Data & Events
📅 Thursday, July 10:
No major scheduled economic releases. Markets remain driven by tariff headlines, bank earnings reactions, and evolving Fed signals.
⚠️ Disclaimer:
This is for informational and educational purposes only—not financial advice. Consult a licensed advisor before making investment decisions.
📌 #trading #marketvolatility #tariffs #banks #Fed #debt #technicalanalysis

Nightly $SPY / $SPX Scenarios for July 9, 2025🔮 Nightly AMEX:SPY / SP:SPX Scenarios for July 9, 2025 🔮
🌍 Market-Moving News 🌍
📦 Tariff Pause Extended to August 1
President Trump delayed the July 9 tariff deadline, pushing negotiations into early August. Markets reacted with muted volatility, suggesting growing comfort that deals will be struck—yet widespread uncertainty remains
💵 Junk Bonds Rally Amid Tariff Tangling
Despite ongoing tariff risks, investors are doubling down on U.S. high-yield (junk) bonds. They anticipate the Fed may refrain from tightening further—favoring spread-tightening to around 7–8% yields—reflecting confidence in credit quality
🏦 Fed Faces Tough Call on Rate Path
New business surveys show conflicting signals: mixed revenue outlooks, cautious spending, and ongoing tariff pressures. The Fed must weigh slower growth against inflationary risks—keeping the door open to rate cuts in the autumn but unlikely before September
📊 Equities Firm Amid Tariff Uncertainty
Stocks showed resilience—S&P 500 and futures held position—after Monday’s tariff-triggered dip. Dip-buying and expectations of extended trade talks kept markets steady despite policy noise
📊 Key Data Releases & Events 📊
📅 Wednesday, July 9:
All Day – Ongoing U.S.–tariff negotiations; markets focused on any progress toward formal deal-making or extension terms.
Midday – Watch for headlines on tariff letters to 14 countries and any movement in trade discussions.
⚠️ Disclaimer:
This information is for educational and informational purposes only and should not be construed as financial advice. Always consult a licensed financial advisor before making investment decisions.
📌 #trading #stockmarket #economy #tariffs #Fed #fixedincome #credit #technicalanalysis

BIDU 1D: triangle breakoutBIDU 1D: triangle breakout + real-world AI deployment boosts bulls
Baidu (BIDU) breaks out of a triangle within a falling channel on the daily chart, with solid volume, reclaim of the 50MA, and approach to the 200MA. $90.09 flips into support. Targets stretch to $105.47 / $113.68 / $124.06 (Fibo levels).
Fundamentally, Car Inc just launched a robo-car rental service powered by Baidu’s Apollo unit. Fully autonomous, bookable for 4 hours to 7 days — this is not future tech, it’s live now. With a $32.6B market cap and low P/E (~12), BIDU looks positioned for revaluation if sentiment shifts.
Tactical setup: entry by market or retest of $90, stop below $82.
When the robot drives customers - you just drive the trade.

Nightly $SPY / $SPX Scenarios for July 8, 2025🔮 Nightly AMEX:SPY / SP:SPX Scenarios for July 8, 2025 🔮
🌍 Market-Moving News 🌍
📉 U.S. Stocks Slip on New Tariff Threats
President Trump announced plans to impose 25% tariffs on imports from Japan, South Korea, Malaysia, Kazakhstan, South Africa, Laos, and Myanmar starting August 1, reigniting trade jitters. The Dow fell ~0.9%, the S&P 500 dropped ~0.8%, and the Nasdaq slid ~0.9% on the news, while bond futures rallied and the dollar strengthened
⚖️ Tariff Pause Deadline Looms
Markets are focused on the July 9 deadline for the current tariff pause, which now hinges on imminent trade negotiations. Investors are balancing the risk of reimposition against progress with agreements involving the U.K., Vietnam, and Canada
💵 Consumer Credit Moderates
June’s consumer credit increase slowed to $10.60 billion vs. April’s $17.87 billion—still strong, but a cooling sign in household borrowing patterns. This tempered the dollar’s rise amid mixed signals on consumer resilience.
🛢️ Oil Drops on Rising OPEC+ Supply
Oil prices fell, with Brent dipping to ~$68.00/barrel and WTI to ~$65.30, after confirmation of OPEC+’s August supply hike—adding to bearish cues for energy stocks .
📊 Key Data Releases & Events 📊
📅 Tuesday, July 8:
3:00 PM ET – Consumer Credit (June)
Moderation in borrowing signals possible easing in consumer-driven growth.
4:30 PM ET – API Weekly Crude Inventories
A key indicator for energy markets; lower inventories lift oil prices, while builds push them down.
Throughout the Day – Tariff Pause Deadline
Market stability hinges on whether trade agreements materialize before the break expires.
⚠️ Disclaimer:
This information is for educational and informational purposes only and should not be construed as financial advice. Always consult a licensed financial advisor before making investment decisions.
📌 #trading #stockmarket #economy #tariffs #consumercredit #oil #technicalanalysis

ES1! S&P500 Might Lose Momentum As Tariffs Deal Not Set...price could probably be testing all time highs. Before plunging....
if the volumes comes with it and reaches the all times high levels, that could be a nice short entry point for potential profits.
Otherwise, it could probably just fill the gap on week open and keep going down in a regular pattern until August as Trumps Tariffs Deals deadline is around that time possiblily...

WOW $4 to $74 Big 1,655% in just 2 daysGet ready for new power runners to emerge from this AMEX:BMNR move

(DEEP) deepbook "new to kraken" Noticed this being new, slipped past me noticing. Publicly known now.

Nightly $SPY / $SPX Scenarios for July 2, 2025🔮 Nightly AMEX:SPY / SP:SPX Scenarios for July 2, 2025 🔮
🌍 Market-Moving News 🌍
🏭 U.S. Manufacturing Remains Under Pressure
The ISM Manufacturing PMI for June rose slightly to 49.0 from 48.5 in May—still in contraction territory. Tariff-induced uncertainty and rising input costs continue to weigh on factory activity, with new orders still weak and employment contracting
📈 Global Factory Rebound Led by India & Europe
While U.S. factories struggle, India hit a 14-month high in its manufacturing PMI at 58.4, and euro‑zone factory orders stabilized at 49.5—the first sign of recovery in over three years. Asia-Europe divergence may shift global capital flows .
🏦 Powell Says Tariffs Are Delaying Rate Cuts
Fed Chair Powell warned at the ECB forum in Sintra that elevated inflation—driven in part by Trump-era tariffs—has postponed the timeline for U.S. rate cuts. The Fed’s dot-plot now indicates only two cuts for 2025, with markets adjusting accordingly
💵 Dollar Nears 3½-Year Lows
The U.S. dollar weakened further, trading near a three-and-a-half-year low amid soft PMI data, a dovish Fed tilt, and renewed optimism over U.S.–Canada trade talks
📊 Key Data Releases & Events 📊
📅 Wednesday, July 2:
(No major scheduled U.S. economic data)
Market focus shifts to upcoming Nonfarm Payrolls on July 3, Powell's remarks, and trade-talk headlines.
⚠️ Disclaimer:
This information is for educational and informational purposes only and should not be construed as financial advice. Always consult a licensed financial advisor before making investment decisions.
📌 #trading #stockmarket #economy #manufacturing #Fed #inflation #charting #technicalanalysis

Nightly $SPY / $SPX Scenarios for July 1, 2025 🔮 Nightly AMEX:SPY / SP:SPX Scenarios for July 1, 2025 🔮
🌍 Market-Moving News 🌍
📊 Core Inflation Edges Higher
May’s core inflation rose unexpectedly to 2.7% year-over-year, up from 2.6%, casting uncertainty over the Fed’s timeline for rate cuts. While headline CPI sits at 2.3%, the resilience in underlying prices complicates policymakers’ projections for later this year
💵 Weak Dollar, Rising Rate-Cut Bets
Markets are reacting to “summertime data”—like the core CPI uptick—with renewed optimism. Traders now see up to 75 bps in Fed rate cuts later this year, while the dollar remains near 3½-year lows on concerns about Powell’s independence and trade developments
🇨🇦 U.S.–Canada Trade Talks Resume
Trade talks between the U.S. and Canada restarted today, following Ottawa’s suspension of its digital-services tax. Progress toward a broader agreement could reduce tariff risk and offer further relief to risk assets
📊 Key Data Releases & Events 📊
📅 Tuesday, July 1:
All Day – U.S.–Canada Trade Talks
Markets will watch for updates on tariff resolution and broader trade deals. Any breakthrough could notably boost equities and improve trade sentiment.
10:00 AM ET – ISM Manufacturing PMI (June)
A below-50 reading again would reinforce the narrative of industrial weakness. A rebound could support equities and temper recession concerns
10:00 AM ET – JOLTS Job Openings (May)
Still at elevated levels (~7.39 million in April), this metric assesses labor-market resilience. A decline could shift rate-cut expectations.
⚠️ Disclaimer:
This is for educational and informational purposes only. It does not constitute financial advice. Consult a licensed financial advisor before investing.
📌 #trading #stockmarket #economy #news #trendtao #charting #technicalanalysis

Weekly $SPY / $SPX Scenarios for June 30 – July 3, 2025🔮 Weekly AMEX:SPY / SP:SPX Scenarios for June 30 – July 3, 2025 🔮
🌍 Market-Moving News 🌍
📈 US Stocks Rally to Record Highs
Following a volatile first half, U.S. equities surged into record territory in late June on a combination of easing Middle East tensions, cooling inflation data, and the 90-day tariff pause
💵 Dollar Weakens on Fed and Trade Uncertainty
The U.S. dollar fell to a 3½-year low, pressured by persistent speculations over President Trump replacing Fed Chair Powell and extending rate-cut expectations, as well as progress in U.S.-Canada trade talks
🇨🇦 U.S.–Canada Trade Talks Lift Sentiment
Canada temporarily repealed its digital services tax to facilitate talks seeking a broader trade agreement by July 21, boosting U.S. equity futures
🛢️ Oil Prices Stabilize
After spiking on geopolitical fears, oil traders settled between $65–78/bbl amid supply relief following ceasefire developments and easing Middle East risks
⚠️ July Risks Loom
The coming week will spotlight:
July 4 deadline for Trump’s tax bill
Expiry of the tariff pause on July 9
U.S. Nonfarm Payrolls on July 3
Each poses potential for increased volatility if outcomes disappoint
📊 Key Data Releases & Events 📊
📅 Monday, June 30
9:45 AM ET – Chicago PMI (June): Gauge of Midwestern factory activity
📅 Tuesday, July 1
U.S. markets open, watch trade developments
📅 Wednesday, July 2
Global PMI readings released
📅 Thursday, July 3 (Early close ahead of Independence Day)
8:30 AM ET – Nonfarm Payrolls (June)
8:30 AM ET – Unemployment Rate (June)
8:30 AM ET – Average Hourly Earnings (June)
These labor metrics will be critical for Fed rate outlooking
⚠️ Disclaimer:
This information is for educational and informational purposes only and should not be construed as financial advice. Always consult a licensed financial advisor before making investment decisions.
📌 #trading #stockmarket #economy #jobs #Fed #oil #trade #technicalanalysis

Nightly $SPY / $SPX Scenarios for June 27, 2025🔮 Nightly AMEX:SPY / SP:SPX Scenarios for June 27, 2025 🔮
🌍 Market-Moving News 🌍
📉 Global Markets Bet on Dovish Fed Pivot
Markets are pricing in more aggressive Federal Reserve rate cuts—approximately 125 bps by end-2026—due to speculation that President Trump may replace Chair Powell with a dovish successor. Investors caution excessive political influence could jeopardize Fed independence
🏦 Fed Governor Warns of Tariff Risks
Fed’s Michael Barr emphasized that tariffs could trigger inflation and unemployment, reinforcing the Fed’s wait‑and‑see approach. Expect modest rate cuts later this year, contingent on economic signals
📉 Q1 GDP Revised Sharply Lower
First-quarter U.S. GDP was downgraded to an annualized contraction of 0.5%, a deeper fall than previously reported. The revision underscores drag from weak consumer spending and trade disruptions
📃 Trade Deficit Widens in May
U.S. goods trade deficit expanded 11% to $96.6 billion, driven by a $9.7 billion drop in exports. Trade gap dynamics remain a headwind for growth projections
🐘 JPMorgan Sees Stagflation Risks
JPMorgan revised its U.S. GDP growth forecast down to 1.3%, warning that tariff-related “stagflationary impulse” is complicating growth and inflation outlooks—and making recession risks more real
📊 Key Data Releases 📊
📅 Friday, June 27:
8:30 AM ET – U. of Michigan Consumer Sentiment – June (Prelim.)
Expected to reflect growing economic caution. The index fell in May; traders will watch for further weakness.
10:00 AM ET – Fed Stress Test Results
Fed to release annual bank stress-test outcomes. Strong results support financial stability, while weak spots could unsettle markets
⚠️ Disclaimer:
This information is for educational and informational purposes only and should not be construed as financial advice. Always consult a licensed financial advisor before making investment decisions.
📌 #trading #stockmarket #economy #Fed #inflation #macro #charting #technicalanalysis
