RLinda ! BTCUSD-> Forming a new cycle? Or...BTCUSD is entering the beginning of a new phase based on cycle formation. The breakdown of the consolidation indicates a continuation of the movement to critical marks, which may motivate many holders of the asset to capitulate. Market maker continues to destroy investors and miners?)
1)
( Chart 1: Falling price below the bitcoin mining industry average)
Bitcoin (BTC) miners are seeking (unwittingly :D) strong selling, which peaked back in 2015 on the back of the cryptohedon of those days. The flagship asset's price is falling below the bitcoin mining industry average, making miners quite nervous. The entire segment seems to be going through a rough patch.
Over the past three weeks (since the first FTX insolvency rumors), BTC miners have increased their selling pressure by almost 400%. That figure has jumped to 2015 levels.
If the price of BTC does not recover in the coming weeks, many miners will be forced to stop working due to heavy losses.
In addition, this period signals that mining can no longer be considered passive income.
The only way to explain the rising hash rate when the price is dumping is for some very big players with access to extremely cheap energy coming into the mining game on a scale of
(Graph 2. Weekly timeframe and estimated development of the situation against historical data)
The current crypto market tests the confidence and trust of participants in the sector:
-Many institutional investors expect the current bearish phase to continue
-Glassnode report supports the same
Average deposit size on all major exchanges is increasing in dollar terms as the bottom is forming (presumably). Average inflow volume is a metric for determining cryptocurrency returns on exchanges after investors sell them.
This trend has been a priority since May and echoes the maneuvers of 2018-2019.
In 2018, a sell-off from the $20000 level led to bitcoin falling to around $3000 in December 2018.
The overall bearish trend continued through 2019. It took about the same time this year for Bitcoin to fall 77% from $60000 levels in November 2021 to a new cycle low on November 22 at $15479
Analysts believe the current downward trend will continue in the coming months following the same pattern as in 2018, where it took several months to form a bottom and move up after the 2018 crash
(Chart 3: Three senior bitcoin timeframes. technical analysis)
The flagship is testing the lows of the last two years and updating the two-week bottom. The price is already below 15500.
Weekly chart: Last week closes near a local low. On Tuesday of the new week, price is headed below the low.
On the monthly chart, price comes out of a 5-month consolidation down. Drill the bottom further.
The daily moving averages are still as resistance.
The daily MACD is in the bearish zone, a new bearish wave is developing on the chart after two big bearish candles form
The daily RSI is in the bearish zone and is falling back to the oversold zone
Sincerely R. Linda!
NEWS

#AAVE - DeFi protocol AAVE faces bad debt and centralized points#AAVE - DeFi protocol AAVE faces bad debt and centralized points of failure
Broken key support now along with some very bearish news. Unlikely new money will be going in even if there is a bullish turn from BTC. Hopefully should be a pretty safe bet here.
protos.com
🟪 #AAVE/USDT
• 🐻 Strategy: Short
• 👉 Exchange: Multi-Exchange
• 👉 Account: Futures
• 👉 Entry mode: Market order in range
• 👉 Invest: 0.59%
• 👉 Leverage: 10x CROSS
• 🚫 Stop: 56.71 (-84.7%)
• 💰 Entry: 52.28 ⌁ 52.85
• ⎿ Current market price: 52.28
• ⎿ Target 1 : 45.04 138.5%
• ⎿ Target 2 : 42.68 183.6%
• 📊 Technical indicators:
• ⎿ 24h Volume: 63355957.71
• ⎿ Satoshis: 52.28

CHZUSDTHello Dear friends
If this month's candle closes positively, the situation will be very attractive, isn't it!?!?
On the weekly time frame, is it possible to complete the head and shoulder pattern at the end of the downward trend?
On the daily time frame a bullish overlapping candle has been created for us, the $0.129 support area has been maintained so far.
At the same time we have an LL. Currently, due to the type of movement, we are not in a mindset to see areas above $0.291.
The CHZ token is one of the most important sports fan tokens, which has a high probability of positive fluctuations due to the World Cup.
We would be happy to hear your comments

What are new-home sales and why do they matter to the economy?Upcoming week we have two important major events happening for the U.S , one of them is the new-home sales. But what exactly are new-home sales, and why do they matter? In this post, we'll break down what new-home sales are and explain why they're so important to the overall health of the economy. You also be more prepared and informed why the market moved in a certain way. Lets move on...
What are new-home sales and why do they matter to the economy?
New-home sales are a measure of trading activity in the market for newly built homes. The new-home sales data are important leading indicators of economic activity, providing timely information on changes in the demand for new homes, which directly affects decisions regarding investment, production, and employment. The data on new-home sales also provide valuable information on the market fundamentals that are shaping trading conditions in the market for newly built homes. The data can be used to inform decision-making about pricing, product mix, and other strategic considerations. In addition, the data can be used to assess market conditions and identify emerging trends. As such, new-home sales data are an important tool for monitoring and understanding the health of the economy.
See historical graph here:
fred.stlouisfed.org
Impact of new-home sales
When new-home sales activity levels rise, it has a positive impact on the economy as a whole. For consumers, this increased activity level leads to currency being put back into circulation. When builders see an increase in new-home sales, they are able to reinvest that currency into building more homes, which in turn provides more jobs for other industry players. The increased activity also has a positive impact on the stock market and it's currency, as builders and other companies who stocks are traded publicly see their stock prices increase. This provides more stability in the markets and can lead to more investors feeling confident about putting their money into the markets. Ultimately, when new-home sales activity levels increase, it provides a boost to the economy as a whole.
New-home sales are an important economic indicator because they signal overall consumer confidence and spending. Increased new-home sales activity levels have a ripple effect throughout the economy, benefiting consumers, builders, and other industry players. We shall see what impact the new-home sales will have this week on EURUSD.
We can currently see we are stuck in a range between support and resistance - let's see what the week will bring.
Trade safe around these hours! Cheers.

How Sam Bankman got Fried Hi Traders, Investors and Speculators 📈📉
Losing $22 Billion in one day is probably a record for the books. Let's take a closer look at the Sam Bankman-Fried story...
At 30, SBF is(was) the youngest billionaire in the US. In 5 years, he managed to start the fastest growing DEX (FTX), as well as Alameda Research. He is also well connected. VERY well connected, with political ties to big names such as actors including Tom Brady, Naomi Osaka and financial institutions including Coinbase Ventures and Binance Labs. So how is it then that he got burnt and lost it all overnight? Let's take a closer look at the intricacies.
First, let's take a closer look at just how big and interconnected FTX really was:
💰 44 Active investors deposit $1.8 Billion in just a year
💰 Celeb Ambassadors including actors such as Stephen Curry, Tom Brady and Naomi Osaka
...hopefully we've learnt our lesson about trusting actors on crypto with Matt Damon on BTC and Ashton Kutcher with his XRP endorsement right before major crashes.... no?
💰 FTX has a combined value of $40 Billion in 2022
💰 FTX sponsors Mercedes in F1
💰 FTX sponsors Major League Baseball, FTX printed on all shirts (guess who's getting a new wardrobe...)
💰 Fortune Magazine Face - "Next Warren Buffet"
After the SEC forced shutdown in 2018 of crypto exchange broker 1Broker, many crypto moguls decided to take their companies elsewhere. This is also true for Sam, who decided to open FTX in Hong Kong later moving to Bahamas, away from the restrictions and regulations of the US. Binance followed a similar path, later moving it's company from China to Cayman Islands. SBF continues to keep favor with the US as he makes large contributions to Joe Biden's campaign, over $11 million. He reportedly spent over $47 million supporting democratic political campaigns. SBF networking progresses and he often testified to congress about how crypto regulations should proceed, even though he moves his business to the Bahamas (not the US). He positions himself as the voice of reasoning for the future of crypto regulations. During 2021, SBF reaches the peak of his wealth and fame. He nd 9 other youngsters are leading the FTX empire from the penthouse in the Bahamas.
Some say he became overconfident, others say he was sloppy. It seems as though the start of his downfall was due to Rival, CZ from Binance. Back in 2019, CZ hinted on Twitter that SBF was involved in an attempted attack on Binance futures platform. CZ later drives down the price of FTT by publicly stating their exit from FTX after "certain revelations came to light". SBF responds with a tweet "you won, well played".
When the bear market arrives late 2021, SBF is portrayed as a saint as he "invests hundreds of millions" in companies such as BlockFi, Voyager and Celcius whilst they face liquidity problems. A research report from September 2022, reveals a different story. He, infact, invest miniscule amounts or even nothing at all to help these companies! But this article does not make headlines, yet. Then a whistle blower breaks the news - Alameda Research uses $10 billion of customers FTX funds to make a risky investment, which is totally illegal. This is the complete opposite of the terms and conditions on his website as well as the opposite of what he said to Congress during his talks about how regulations should be. This is where the saying "not your keys, not your crytpo" shines. Crypto users and SBF fans are heart broken... How could he??
The final blow: Recently, continuous rivalry on crypto twitter between CZ and SBF fuels the price drops on FTT as CZ claims to sell all remaining tokens. Alameda Research (one of the 9) jumps in and claims to "buy back" whatever CZ has left to sell. But then, another stroke of bad luck - the balance sheets of Alameda Research leaks. As it turns out, they have NO liquidity, especially not enough to make any FTX buyback. And so, overnight, the price drops a whopping 89% and there goes most of SBF's wealth.
Final Thoughts...
If you're smart enough, have the right support structures and a great PR team, you can grow your fortune with fake virtue signaling. Infact, many philanthropes ( unlike Jeff Bezos 's ex wife whom you probably don't even know about ) will only donate when the camera's are on. They also ensure that they are highlighted as kind hearted saints by the media. They do whatever it takes to hide all the corruption and money laundering behind the scenes. SBF was portrayed as the humble, young billionaire face op crypto, and everyone wanted him in their corner due to his trading brilliance and profitable partnerships. Sometimes, however, when the bad deeds start outweighing the good ones exponentially, it becomes increasingly hard to hide the true events from the public .It has, somehow, come to light that instead of being a humble and charitable public servant, SBF was the leader of a group of kids living the highlife in a penthouse in the Bahamas. Misusing funds for corruption and illegal activities including but not limited to money laundering. And so came the fall of Sam Bankman Fried. His downfall involves deception, illegal activities, large political contributions and the misuse of customer funds. It is noteworthy that most of his wealth was in FTT, native crypto to FTX decentralized exchange (DEX) .
💭...This is no uncommon thing. Many people do the same illegal stuff, probably even on a larger scale but somehow, SBF got burnt. You can't help but wonder... Who Fried Sam Bankman ?
_______________________
📢Follow us here on TradingView for daily updates and trade ideas on crypto , stocks and commodities 💎Hit like & Follow 👍
We thank you for your support !
CryptoCheck

Possible reversal on EURUSDYesterday EURUSD reached 1,0440 followed by 200 pips drop to 1,0284.
There will be further volatility caused by the news today. ( US October Retail Sales)
This could be a good time to reverse the movement in EURUSD.
New upward movement to 1,0500 is possible, but no buys are recommended from these levels.
There will be sales opportunities in case of new pullback.

ZBThere is a big probability that ZB and Zn will going to 125,20 the first reason is in the daily fram we have a double bottom pattern and today ZB casse a range with a volume very big

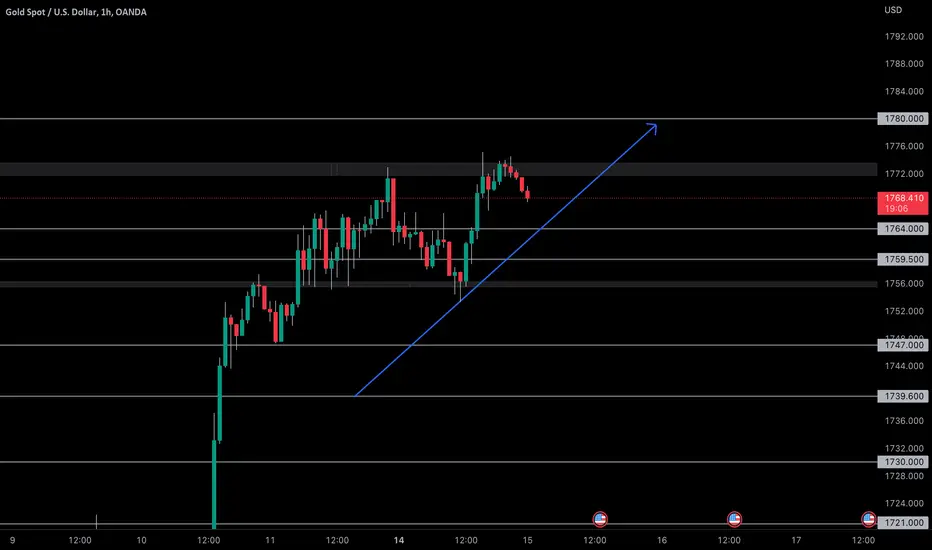
Impulse level breakdown. Gathering of liquidityA strong local resistance level has formed on the instrument, behind which there are many stops of participants, as well as the formation has the form of an ascending triangle, which indicates the interest of buyers.
I will wait for the formation of consolidation and impulse breakdown of several percent with volumes in the tape.

BTC Will Touch $21 to 25$ in this WeekBINANCE:BTCUSDT
Time is over
btc now growing
inshallah will touch 21K Soon
in this week you will see new movement from BTC

Gold SetUp ⚠️(Before News)⚠️I am personally waiting for signs of exhaustion in GOLD to continue buying GOLD. (Key levels 👆🏻)
Gold buys
DXY bear
USD soft
BATUSD shortTwo levels of supply ill find it hard to even move past the first dropping -29% percent in the last 5 days and is predicted to be a dollar by 2024 at current pace.


Looking at price action on AUDUSD following CPI reportsInflation is one of the key factors in FED's decisions. It is expected to move the market every time it gets released, especially now that FED is watching.
Previous CPI was on 13/10 - 0.6% against 0.4% forecasted.
There wasn't any directional move on that day, just liquidity sweep on both sides.
Before that, another report came out on 13/09 - 0.6% against 0.3% forecasted.
Price broke out previous session's high before the event and dropped massively with its announcement. So far, this is a never-look-back level.
On 10/08, there was second of only two reports this year that turned out with negative surprise - 0.3% against 0.5% forecasted.
There isn't any immediate low or high breach worth mentioning, the price just rocketed through everything in close vicinity. However, as I marked with Yellow line, there was a significant swing high in 60 days period that was breached only for price to return below it and never look back after. I am adding daily chart below with all of the reports.
From the daily chart, we may conclude that CPI report has a tendency to create Monthly or even multi-month Lows and Highs. Just in the latest 60 day window, the highest price was September's CPI, the lowest price in that window is October's CPI. With the exception of June, the reports always created a significant High or Low or were or were only one day away from it.
Most CPI candles also exert visibly above-average movement and like to take on liquidity in close proximity to the price.
A negative surprise (inflation lower than expected) would likely lead above 0.655, perhaps up to 0.66, but is unlikely to change the trend. This would, therefore, be another highest high for months to come.
A positive surprise could quicklu steer the price below 0.625. I don't think it will go back up on positive surprise, it looks like that would high resistance run, because the price has provably tried to go there and failed on Wednesday's London session. It dropped instead and following New York session made another attempt, yet did not even beat London session there.
Legend:
Lines:
Violet - Monthly Highs and Lows
Dark blue - Weekly Highs and Lows
Cyan semi-transparent - Daily Highs and Lows
Cyan dashed semi-transparent - New York Midnight
Yellow semi-transparent thick - estimated liquidity area
Other:
Purple channel - Single Print, price went either down or up without any overlaps on higher timeframe charts
Yellow, blue, ted rectangles - key forex sessions, first three hours

If BTCUSD survives, where would I buy?Full disclosure, I have a small amount of BTCUSD on Coinbase and I am in the red. So I am not necessarily the best person to follow when it comes to Crypto.
That said, I do believe that humans and computers have aligned and the BTCUSD is trading very textbook in terms of technicals.
Early adopters took BTCUSD from $0 to nearly $70,000 which in anyone's book is an impulsive move, and in other people's book a classic pump and dump.
When we're talking penny stocks this chart I believe would go to $0. But we're talking about an asset that has Institutional Money involved. Even the wealth of small countries.
I have used Elliot Wave to denote where I believe the BTCUSD has been and will go in the future.
Green waves 1-5, a classic impulsive move.
Red waves ABC, classic corrective 3 waves move lower.
The original range that I am working with starts with what I consider the first major pullback. Green 1 to 2.
Recently the BTCUSD had been consolidating at the top of that range around the $20k mark. Recent events in crypto land have flushed out more holders as FTX loses liquidity and Binance steps aside from doing anything to help.
Looking back to late 2020 price broke out of the range and left an area of imbalance. Institutional algos do not like being left on the sidelines. So they wait patiently with their orders and use their algo to push price lower (in this case). News and fundamental events accelerate prices to wherever the money wants the price to go. Adding some fear along the way is good business.
If we are in a corrective move, rather than a waterfall to $0, Wave A could = Wave B~C and that takes us to the Mid Range / Lower Imbalance line. Which would be a very neat trick.
I have also used an Andrews Pitchfork to indicate where the price could land. As the original range expanded by nearly 4x, I have used the 4th deviation on the Pitchfork too. This intersects the Mid Range / Lower Imbalance line in May 2023, so in terms of timing, we may have 6 months of correction still to go through.
If BTCUSD is not going to $0 and Institutional Money does buy around the $11500~$12000 levels, the next wave up is a larger wave 3, which for those of you still following, is a very large impulsive move higher. Michael Saylor will be proven to be right.
I am not buying anything until we close the imbalance below. Unless we start making a bullish move higher, which would reverse the break of structure that we saw at $28800.
Good luck if you HODL, I have definitely been in this position before, where my gut told me it would be okay, only to see a share go to $0. The upside potential is always worth it in my opinion. Only risk what you can afford to lose.

solana in a bad situation :According to CoinMarketCap, SOL is the tenth largest cryptocurrency by market capitalization, but it may lose its position at the top as a result of the growing drama surrounding the FTX exchange. FTT and SOL tokens have been sold off after information about the possible insolvency of Alameda Research, an affiliate of FTX, and its CEO Sam Bankman-Fried became public. While it is clear that FTT is a native FTX token and a major asset in Alameda accounts, little is known about Solana. At the same time, Alameda has $1.2 billion in SOL on its balance sheets, according to the data. Experts note in this regard that, in addition to the pressure on the SOL price caused by

XAUUSD potential movement and entry1) NEWS TO NOTE:
THE FEDERAL RESERVE AND THE BANK OF ENGLAND INCREASED INTEREST RATES BY 0.75% EACH WHICH STRENGTHENED USD AND GBP WHICH IS BAD NEWS FOR GOLD.
JEROME POWELL (CHAIRMAN OF FEDERAL RESERVE GAVE A VERY HAWKISH SPEECH A COUPLE DAYS AGO IN WHICH HE AFFIRMED THAT INTEREST RATES WILL BE RISING WHICH ALSO STRENGTHENED USD)
TODAY (FRIDAY 4TH) US NONFARM PAYROLLS CAME OUT WITH BETTER THEN EXPECTED DATA ABOUT US EMPLOYMENT
MORE EMPLOYMENT →MORE PEOPLE IN ECONOMY →MORE MONEY IN CIRCULATION →MORE INFLATION → MORE REASON FOR FED TO INCREASE INTEREST RATES → STRONGER USD → WEAKER XAUUSD
2) UPCOMING NEWS TO NOTE:
THURSDAY 10TH NOVEMBER CPI (upcoming September US inflation report) →THIS WILL EFFECT GOLD BECAUSE IT EFFECTS USD
Stubborn readings could translate into sustained elevation in Feds rate hike odds (sustained higher interest rates). While this would be good news for the US Dollar, it will likely be bad news for US stocks and gold prices.
3) TECHNICAL ANALYSIS
I expect the price to have a short drawback towards the primary resistance line, however, the primary resistance line (top resistance line) is unlikely to be tested (touched by price) due to the bullish momentum of gold. Then I expect gold to continue on its uptrend. If the primary resistance line is tested, it would be an excellent entry with a risk to reward of 1:2. If it is not tested, i wouldn't advise a buy order, unless there is candle patterns and chart patterns which suggest a strong bullish momentum (for example a engulfing candle or a 3.82 candle or a close above candle. In the past couple of days there has been higher lows and higher highs however this is only intraday, and over a bigger time-frame gold is bearish.
Notes:
PlEASE GIVE ME FEEDBACK I WOULD APPRECIATE IT SO MUCH
TRADE WITH CAUTION
HAVE A GOOD DAY
THANKS
SNIPER

It's time for a pullback on EURUSD Yesterday, EURUSD reached 0,9750 where it found support that caused the beginning of a pullback.
Today we also have important news for the USD - NFP.
Right now it,s best if we wait for the end of the pullback before taking another trade.
We should look for market reaction around 0,9870!

Huge limit order on the level is detected!Waiting for the upcoming breakout. The next touch of the support level will probably provoke short impulse. Huge limit order on the level is detected. Open short position right in execution of huge limit order. Target - 0.01130

Bitcoin BTC Crypto Trying to Break Major Support line Bitcoin BTC Crypto is trying to Break thru the biggest resistance line yet $21,043. This resistance line was formed from a Head & Shoulders Pattern from the all time high which broke down and brought in this Bear Market. Additional Bullish Patterns have formed waiting to be fulfilled sending us to the following price points: Oct. 13, 2022 Bullish Falling Wedge Pattern +231% $61,764; Oct. 13, 2022 Bullish Falling Channel Pattern +121% $41,737; Oct. 25, 2022 Bullish Falling Wedge +33% $25,535; (Pending) Bullish Raising Triangle +7% $22,692
Pending Patterns price points; Oct. 13, 2022 Bullish Falling Wedge Pattern +231% $61,764; Oct. 13, 2022 Bullish Falling Channel Pattern +121% $41,737; Oct. 25, 2022 Bullish Falling Wedge +33% $25,535; (Pending) Possible forming a Bullish Raising Triangle +7%
The Market currently wants to go up....................... This current pattern forming will set the path

AMAZON!!!Hello ladies and gentlemen, according to my graphical analysis, I hope that you are not buyers at all from NASDAQ:AMZN because the latter is heading to 70 USD.
Should you require any recommendations, please feel free to contact me.

Trading Psychology (Part 3)As we head into the FOMC interest rate decision, here are some guiding thoughts when you are trading a major news event.

GBPNZD testing support + newsPrice is testing the support for the 4th time, such as MACD.
We can see the columns in MACDS indicator losing power, and the line crossing each other.
About candles we've a three inside up after testing the support, show us a bullish signal.
And to conclude the Reerve Bank of New Zeland says "economy will slow as rising rates curb consumption", the houses prices are still expensive; and this morning in NZ we had data about unemployment and employment, and:
Unemployment: 3,3%, higher thand expected (3,2%). They though the rate was lower than last Q, but is the same as the previous and higher than expected.
Employment: Higher than expected with a change of 1,3bp and the forecast was 0,5%
---------------------------------
Dont forget about yesterday:
BOE made a £838b stimulus and sold £750m of gilts

USOIL,WTIafter few hours big weekly news comes out
and I think oil supplements going to increase than expectation.
