BTC in Greed Zone, Overbought RSI: Correction or Instant Pump?GM crypto bro's, this morning the fear and greed index remains in the greed zone at 73, while the Stoch RSI is in the overbought area.
BTC has made a slight correction this morning, and with the weekend approaching, which usually sees low volume and normal corrections, BTC may revisit the 64K - 63K range, or perhaps dip further into the 62K - 61K range.
However, an instant pump back to 69K is still a possibility. Keep in mind, the market is dynamic. Don’t FOMO, always manage your risk, and as always, this is Akki signing off—one chart, one love. Have a nice day and stay SAFU.
NEWS

BITCOIN in Greed Zone , Will BTC Peak at 69K Before Correction?GM crypto bro's, we are still in the greed zone at 71 this morning, and Stoch RSI is at the peak of overbought. BTC reached a top around 68K.
Looking at the price action, there's a strong possibility BTC will visit 69K first before a correction towards 64K. But keep in mind, with the market in this greedy state, don't get FOMO. Always maintain your risk, and as always, this is Akki signing off—one chart, one love. Have a nice day and stay SAFU.

BTCUSD—Greed Zone 73, Will BTC Hit 69K or Retrace First?GM crypto bro's, this morning the fear and greed index is still in the greed zone at 73, and the Stoch RSI is already in the overbought area. Last night, BTC pumped significantly to around 67,800.
Will the correction to the 64K - 63K range not happen? The market is dynamic, so it’s hard to predict with certainty whether a correction will occur. However, personally, I see a big probability for a correction before BTC hits 69K.
But keep in mind, with the market in this greedy state, don't get FOMO. Always maintain your risk, and as always, this is Akki signing off—one chart, one love. Have a nice day and stay SAFU.

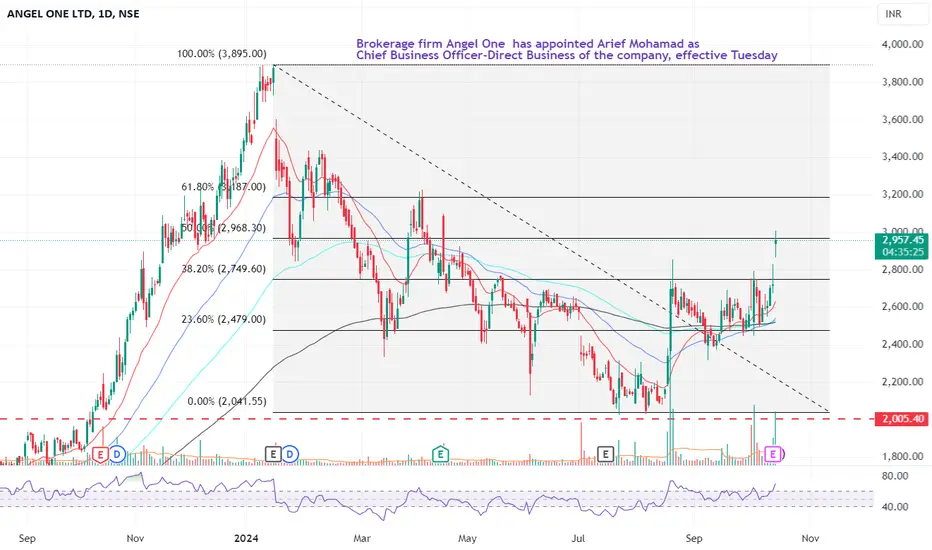
Angel One Breaking Key Resistance Level Amid Leadership ChangeAngel One Ltd (NSE: ANGELONE) has witnessed a sharp upward movement, with today’s price action breaking past the key Fibonacci retracement level of ₹2,968 (61.8%) after bouncing off the support near ₹2,600. The recent appointment of Arief Mohamad as the Chief Business Officer - Direct Business could be a key factor boosting investor confidence, triggering this strong bullish momentum.
Key observations:
The stock is trading above its 20-day, 50-day, and 200-day moving averages , indicating strong bullish sentiment.
Immediate resistance is seen around ₹3,187 (next Fibonacci level) , while strong support rests at ₹2,749 (38.2% retracement level).
RSI is hovering near 70, showing an overbought condition. A pullback may be expected, but if momentum continues, a breakout toward ₹3,400 is possible.
This move shows the potential for further upside, though caution is advised with the RSI entering overbought territory. Traders might want to watch closely for a potential pullback or consolidation in the near term.
BTCUSD—After Pump to 66K, What’s Next? incomming dump?GM crypto bro's, this morning fear and greed index entered the greed zone at 65, while Stoch RSI is nearing the overbought area. BTC has finally hit 65K, even reaching 66,480, and this pump pushed the index into greed.
What’s next for BTC? Normally, after a pump and hitting greed status, a correction is likely. Looking at this morning's price action, the areas that could be retested are the 64K - 63K yellow zone and the 62K - 61K red zone.
However, there's also a chance BTC could do an instant pump to 69K again. Keep in mind the market is dynamic—don’t get FOMO. Always manage your risk, and as always, this is Akki signing off—one chart, one love. Have a nice day and stay SAFU.

BTCUSD—Small Retrace Before 65K? or incoming pump ?GM crypto bro's, back to working day! This morning, fear and greed index is at 48, neutral zone, while the Stoch RSI is still heading towards the overbought area.
Price action suggests a small retrace to around 61K might happen today, but the bigger picture still leans towards 65K. Keep in mind the market is dynamic—don’t get FOMO. Always manage your risk, and as always, this is Akki signing off—one chart, one love. Have a nice day and stay SAFU.

BTCUSD—Road to 65K Continues !, Caution for another drop?GM crypto bro's, happy weekend! Fear and greed index remains neutral at 50, and the Stoch RSI is signaling it’s heading towards the overbought area.
Today’s market update is pretty similar to yesterday—Bitcoin is still on its way to 65K. Keep in mind the market is dynamic—don’t get FOMO. Always manage your risk, and as always, this is Akki signing off—one chart, one love. Have a nice day and stay SAFU.

BTCUSD—65K Target Hit? What's Next for Weekend Trading?GM crypto bro's, happy weekend! Fear and greed index is back to neutral at 49, and the Stoch RSI is rising out of the oversold area. Today, BTC has pumped as I mentioned in yesterday's market update, with a high probability reaching the 65K target range.
However, this doesn’t mean the risk of a dump is over. Keep in mind the market is dynamic—don’t get FOMO. Always manage your risk, and as always, this is Akki signing off—one chart, one love. Have a nice day and stay SAFU.

BTCUSD—Bounce Back to 65K Incoming? CPI Data Drives DropGM crypto bro's, fear and greed index is in the fear zone at 32 this morning, with Stoch RSI now sitting in the oversold area.
BTC dropped again this morning, just as I mentioned in yesterday’s update, touching the 59K–58K range. This may have been caused by the higher-than-expected CPI data release. Now, will BTC drop even further? Based on this morning's price action, the probability seems to lean more towards a pump to 65K rather than another drop to 58K.
Keep in mind the market is dynamic—don’t get FOMO. Always manage your risk, and as always, this is Akki signing off—one chart, one love. Have a nice day and stay SAFU.

BTCUSD—Price Action Targeting 58K–59K, Market Turning RedGM crypto bro's, Fear and Greed Index is in the fear zone this morning at 39, with Stoch RSI dropping back into the oversold area.
As I remind you every day, always be cautious of potential dumps. In yesterday’s market update, I expected BTC to visit 65K first, but the market had other plans, dropping to 60K. Now, where’s BTC heading next? Price action suggests a potential visit to the 59K–58K range, around the red zone, with a possible slight reclaim to 61K.
Keep in mind that the market is dynamic—don’t get FOMO. Always manage your risk, and as always, this is Akki signing off—one chart, one love. Have a nice day and stay SAFU.

BTCUSD—Sideways Action with 65K Target, keep Stay Alert GM crypto bro's, the market is moving sideways this morning with the Fear and Greed Index at a neutral 49, and Stoch RSI exiting the oversold zone.
Overall, the target remains the same at 65K, but the risk of a dump still exists. Keep in mind that the market is dynamic—don’t get FOMO. Always manage your risk, and as always, this is Akki signing off—one chart, one love. Have a nice day and stay SAFU.

Crude Oil Technical Analysis - October OutlookCrude oil is showing a notable recovery from its recent lows, currently trading around the $72 mark. A few key observations based on the price action and indicators:
Price Pattern and Trend:
The chart shows a classic descending wedge pattern, which signals a potential bullish reversal. The breakout from the wedge is accompanied by a price surge above the 20-day and 50-day moving averages, suggesting a short-term trend change.
Key Support Levels:
Immediate Support : Around $70.64, marked by the breakout level.
Strong Support : At $68.23, where significant buying interest has been observed in the past, reinforced by a bullish consolidation zone.
Resistance Levels:
First Resistance: $72.11, which has been tested, with potential room for the price to move higher if momentum sustains.
Critical Resistance : $77.23, which coincides with a strong historical supply zone. A close above this level would signal further bullish momentum
.
Volume Profile Insight:
A noticeable shift in the volume profile near the $70 mark suggests accumulation by institutional investors, hinting that buyers are stepping in to defend this level.
RSI Indicator
: The Relative Strength Index (RSI) has bounced back from oversold levels and is now showing early signs of positive divergence, supporting the case for an upward move.
Geopolitical Factors:
With rising tensions in the Middle East, as highlighted in the annotation, traders and investors are pricing in potential supply disruptions, contributing to the recent spike in oil prices.
Conclusion:
Oil prices may continue to rise in the short term, with $72.11 being a key level to watch. If sustained above this, the next target would be $77.23. However, if prices fall back below $70, we could see a retest of support at $68.23. Given the geopolitical uncertainty, traders should remain cautious of potential volatility.

BTCUSD Midweek Outlook—Pump to 65K Likely with Small Dump RiskGM crypto bro's, this morning, the Fear and Greed Index is neutral at 49, while the Stoch RSI has started to exit the oversold area.
Yesterday's candle (07/10) touched 64K but dropped back to 62K this morning. What’s next for BTC? Based on price action, there's a high probability for another pump up to 65K. Though a deeper dump is possible, I personally think the pump probability is higher.
The market is dynamic—don’t get FOMO. Always manage your risk, and as always, this is Akki signing off—one chart, one love. Have a nice day and stay SAFU.

BTCUSD Weekend Outlook—Targeting 64K with Potential Drop to 59KGM crypto bro's, happy weekend! This morning, the Fear and Greed Index remains neutral at 50, while the Stoch RSI is slowly exiting the oversold zone.
Today’s market outlook is similar to yesterday’s, with a target of 64K, though there is still potential for another drop, possibly back to the 59K area.
The market is dynamic—don’t get FOMO. Always manage your risk, and as always, this is Akki signing off—one chart, one love. Have a nice day and stay SAFU.

BTCUSD Reclaims 62K with Bullish Signs—Potential to Reach 64KGM crypto bro's, this morning the Fear and Greed Index has increased, moving out of the fear zone and into neutral at 49. Meanwhile, the Stoch RSI is signaling potential upward movement.
BTC has reclaimed the 62K area as I mentioned in yesterday's update, and the bullish price action seen this weekend may increase the probability of BTC reaching the 64K range.
The market is dynamic—don’t get FOMO. Always manage your risk, and as always, this is Akki signing off—one chart, one love. Have a nice day and stay SAFU.

NZD/USD Slips as Fed Powell Hints at Gradual Rate CutsThe NZD/USD pair has been losing ground in the wake of Federal Reserve Chair Jerome Powell's recent remarks, indicating that interest rates will be lowered gradually "over time." This dovish signal from Powell has bolstered the US Dollar, placing additional pressure on the New Zealand Dollar (NZD).
Adding to the bearish sentiment, the upcoming US ISM Manufacturing PMI for September is projected to show a slight improvement, with expectations set at 47.5 compared to the previous reading of 47.2. A better-than-expected result could further support the USD, reinforcing the downward trajectory of the NZD/USD pair.
On the New Zealand front, economic data has also been less than favorable. The country’s Building Permits fell by 5.3% month-over-month in August, a significant reversal from the substantial 26.4% increase recorded in July. This decline reflects a slowdown in the construction sector, further weakening the New Zealand Dollar.
From a technical perspective, NZD/USD has reached a key supply area where the price seems to be reversing. The Commitment of Traders (COT) report also aligns with this potential reversal, showing a shift in sentiment towards the USD. Coupled with the latest economic news and the anticipation of stronger US data later today, the technical indicators and fundamentals both point to a continued bearish outlook for NZD/USD.
In conclusion, with Powell’s dovish comments, weak New Zealand data, and the likelihood of stronger US economic reports, the NZD/USD pair appears poised for further declines. Traders should watch for confirmation from today’s ISM Manufacturing PMI release, which could boost the USD further and solidify the reversal in NZD/USD.
✅ Please share your thoughts about NZD/USD in the comments section below and HIT LIKE if you appreciate my analysis. Don't forget to FOLLOW ME; you will help us a lot with this small contribution.

BTCUSD Struggles Amid Fear—Downtrend Continues ?GM crypto bro's, this morning BTC continues its decline, with the Fear and Greed Index now sitting at 41 in the fear zone, and the Stoch RSI still in the oversold area.
Looking at the price action on the H4 timeframe, there’s a small chance BTC could reclaim the 62K area, but the probability of further decline to 59K is higher. With the weekend approaching, we can expect low volume in the market.
The market is dynamic—don’t get FOMO. Always manage your risk, and as always, this is Akki signing off—one chart, one love. Have a nice day and stay SAFU.

BTCUSD Approaching Accumulation Zone – Fear Dominates, Oversold GM crypto bro's, this morning the Fear and Greed Index remains in the fear zone, sitting at 37, and the Stoch RSI has entered the oversold area.
The candle close on the 2nd has not managed to break above 62K. However, this doesn’t mean the potential for 69K is off the table. Given the price action and the current Fear and Greed Index, now might be a good time for accumulating more Bitcoin.
The market is dynamic—don’t get FOMO. Always manage your risk, and as always, this is Akki signing off—one chart, one love. Have a nice day and stay SAFU.

BTCUSD October Fear Zone – Is 69K Still on the Horizon?GM crypto bro's, finally BTC corrected to the range I've been reminding you about for days now, dipping as low as 60K, and currently, the price is sitting at 61,163. The Fear and Greed Index has dropped into the fear zone at 42, accompanied by the Stoch RSI entering the oversold area.
What's next for BTC? If today's candle closes above 62K, there's a strong potential for 69K to become the next target. However, if the price fails to close above that range, we might see another drop to 59K.
As I remind you daily, the market is dynamic—don’t get FOMO. Always maintain your risk, and as always, this is Akki signing off—one chart, one love. Have a nice day and stay SAFU.

Bitcoin fail Septembull, Drop or Just a Setup for the Next Pump?GM crypto bro's, today BTC's monthly candle closed without achieving a Septembull, showing instead a tendency for further correction. The Fear and Greed Index is at 50, along with a significant drop in the Stoch RSI.
As mentioned in previous updates, there is still a potential correction down to the 60K - 59K range. BTC currently sits at 63,538 with a strong bearish candle. Is the pump to 69K still possible? Yes, but I personally see only a 30% chance for that, while the probability of a correction to 61K - 59K is around 70%.
Happy payday to those who got paid! Remember, the market is dynamic—don’t get FOMO. Keep buying more Bitcoin, maintain risk even though life is full of risks. A great sailor isn’t great because of a luxurious ship but because of their skill as the captain. As always, this is Akki signing off—one chart, one love. Have a nice day and stay SAFU.

BTCUSD Correction to 60K - Will September Close Bullish?GM crypto bro's, happy Monday! This morning, the Fear and Greed Index is sitting in the greed zone at 61, while the Stoch RSI remains overbought.
BTC has started to show signs of correction from the 66K range. The potential correction area remains the same as mentioned in our previous updates, targeting the 60K - 59K range, or maybe it will only hit 61K. Keep in mind that tomorrow is the monthly closing candle for September. If BTC closes above 64,700, then we could consider this a Septembull finish.
Remember, the market is dynamic—don’t get FOMO. Always be aware of correction possibilities because anything can happen. Always manage your risk. That’s all for today’s crypto update, this is Akki signing off. One chart, one love. Have a nice day, stay SAFU, and don’t forget—buy more Bitcoin.

BTCUSD Holding 65K - Pump to 70K or Correction to 60K?GM crypto bro's, happy weekend! This morning, BTC is still holding in the 65K range with the Fear and Greed Index in the greed zone at 63, while the Stoch RSI remains in the overbought area just like yesterday.
Today's market outlook is still the same—potential for an instant pump to 69K - 70K, but also the possibility of a dump down to the 60K - 59K range. So, keep staying safe out there! Remember, the market is dynamic—don’t get FOMO. Be cautious of potential corrections because anything can happen. Always manage your risk. That’s it for today’s crypto update, this is Akki signing off. One chart, one love. Have a nice day and stay SAFU!

BTCUSD Weekend Outlook - Greed Zone at 64, Correction or Pump?GM crypto bro's, happy weekend! This morning, the Fear and Greed Index is in the greed zone at 64, while the Stoch RSI has risen back to the overbought area.
Today's market outlook remains similar to yesterday’s, with a potential correction around the 60K - 59K range, while the pump target is 69K - 70K. Considering it’s the weekend and nearing the end of the month, a correction is likely, especially with the Fear and Greed Index showing high greed at 64.
Keep in mind, the market is dynamic—don’t get FOMO. Be cautious of potential corrections because anything can happen. Always manage your risk. That’s it for today’s crypto update, this is Akki signing off. One chart, one love. Have a nice day!
